We’ve shipped the Debrief VS Code Extension v0.1.0 — bringing maritime tactical analysis directly into your development environment.
What We Built
The extension provides the foundation for analyzing maritime plots:
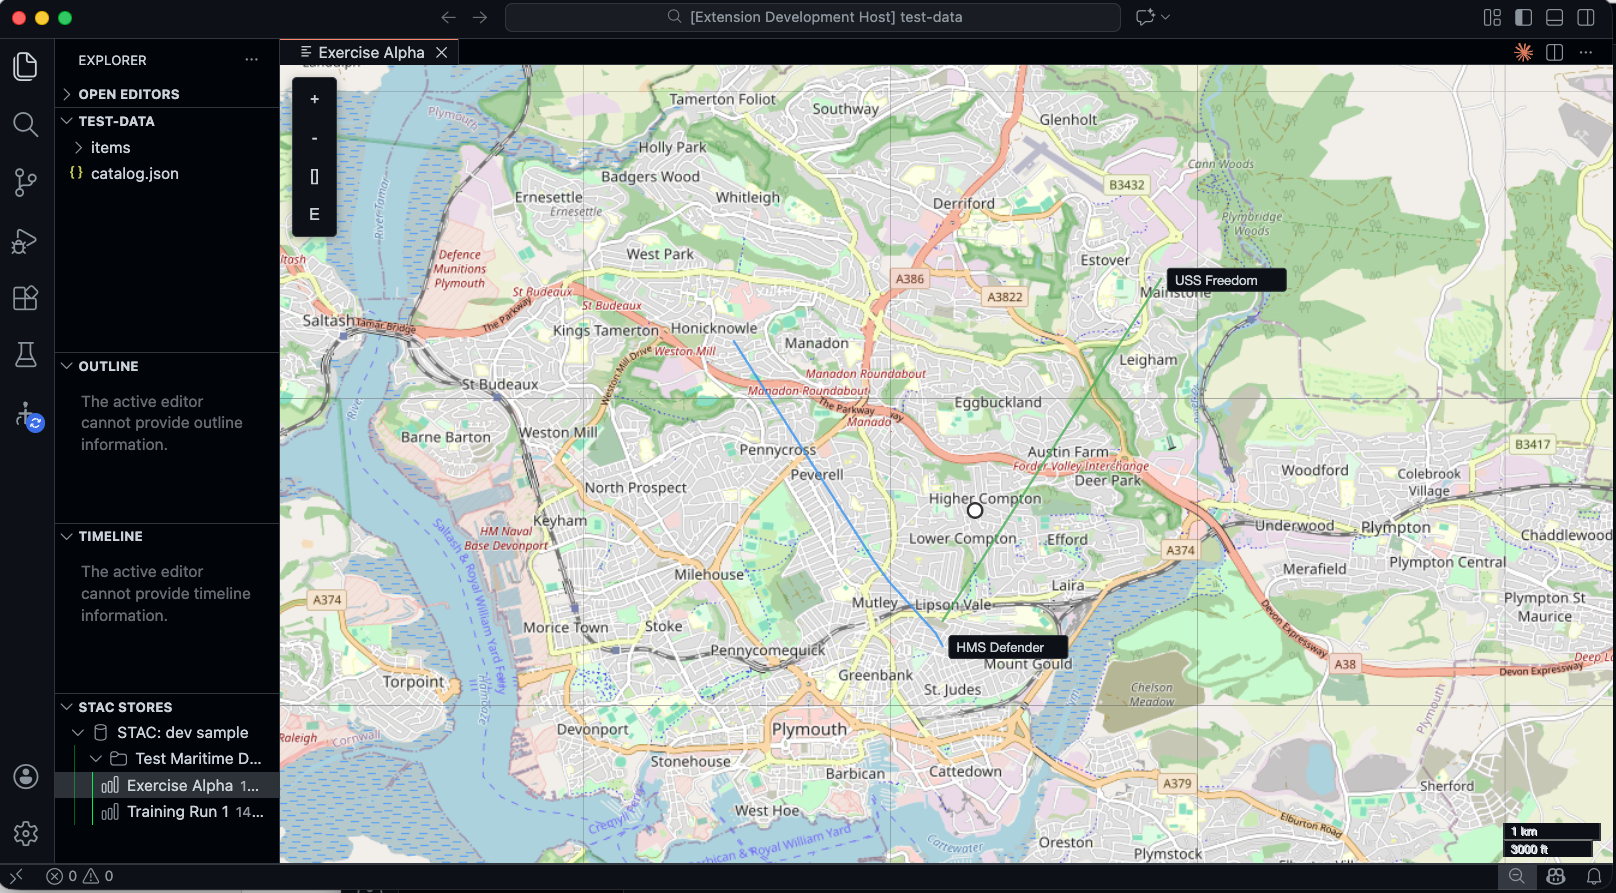
- STAC Store Integration: Register local STAC catalogs as virtual folders in VS Code Explorer
- Interactive Map Display: Leaflet-based maps with Canvas renderer handling 10,000+ track points
- Track Visualization: Colored polylines with labels at start points and hover tooltips
- Selection System: Click, Shift+click, and Ctrl+click with animated glow effects
Technical Highlights
Performance First
We chose Leaflet with Canvas renderer over SVG for large datasets. The difference is dramatic — smooth panning and zooming even with thousands of track points.
Message-Based Architecture
The extension uses typed message passing between the extension host and webview:
type WebviewMessage =
  | { type: 'loadPlot'; plot: Plot }
  | { type: 'setSelection'; ids: string[] }
  | { type: 'updateTracks'; tracks: Track[] };
This clean separation makes testing straightforward and keeps the webview stateless.
Webview State Persistence
The map view saves its state (center, zoom, track colors) so reopening a plot restores exactly where you left off.
What’s Next
With the VS Code Extension foundation in place, we’ve completed Stage 6 of the tracer bullet. Future updates will bring:
- Analysis tool integration via MCP protocol
- Timeline visualization component
- Result layer overlays for analysis output
- Cloud STAC catalog support
Try It
Clone and build locally:
cd apps/vscode
pnpm install
pnpm run compile
# Press F5 to launch Extension Development Host
Add the test-data folder as a STAC store to see sample plots with vessel tracks.