flowchart LR
  A["Analyst<br/>'trim the first 10 min<br/>off this track'"] --> B["Copilot Chat<br/>(agent mode)"]
  B --> C["Debrief LM tools<br/>searchPlots · summarize<br/>listTools · runTool"]
  C --> D["debrief-calc<br/>(Python, stdio)"]
  D --> E{"mutates<br/>the plot?"}
  E -- "yes" --> F["plain-language<br/>confirmation"]
  E -- "no" --> G["Results panel<br/>+ chat reply"]
  F -- "approved" --> H["live edit on the<br/>open map — dirty,<br/>never written to disk"]
  C -. "reads open plot<br/>+ selection" .-> I["Debrief editor"]
  H --> I
What We Built
I wanted to know what it feels like to talk to Debrief. So this spike wires GitHub Copilot Chat, in agent mode, directly into the VS Code extension: you type “find me the exercises off the Solent” or “trim the first ten minutes off this track”, and Copilot does it — searching the local STAC catalogue, opening a plot, and running Debrief’s own Python analysis tools against whatever you have open. The extension registers four tools with VS Code’s Language Model Tools API, so Copilot discovers them the same way it discovers any other agent tool, and every call flows back through the extension — which means the chat always knows which plot is open and what you have selected.
The honest framing up front: this is an experiment, not a product. Copilot is cloud-backed, and Debrief’s constitution is offline-by-default, so nothing here ships as-is. The point is to learn how a chat agent actually drives Debrief through a tool surface — where it stumbles, what a plot summary costs in tokens, how different models cope — so the real prize, an in-Debrief natural-language panel that runs against a local model, has something concrete to build on.
How It Works
This is the reconnaissance run for epic E13 — the offline NL panel (spike #235). Rather than inventing a bespoke chat surface to prototype against, it borrows one that already exists (Copilot agent mode) and points it at the tool boundary the future panel will also have to speak to. Search reuses the same stacService.listItems and debrief.openPlot command the file tree already uses; tool execution reuses the exact debrief-calc Python stdio path the Tools panel already drives. Everything Copilot-specific lives quarantined in a new src/copilot/ folder, and the spike ships learning instrumentation — per-invocation telemetry, a token-budget probe, a multi-model comparison, a domain-priming A/B — all feeding a findings report that outlives the throwaway code.
Key Decisions
- Language Model Tools API over an MCP server or a
@debriefchat participant. All three could expose the tools, but only the extension-mediated LM Tools path lets each call carry live editor context — the open plot, the current selection — without the model having to name a file. That context is the reason the interaction feels like driving Debrief rather than querying a database. - Chat edits never touch disk. This is the single most important safety decision. Where the Tools panel writes results straight to the STAC store, chat edits apply only to the open editor’s in-memory features and mark the session dirty. You review and save exactly as you would a manual edit — nothing is written from a chat turn. Read tools auto-run; anything that modifies the plot gates on a plain-language confirmation first. Default-strict, defence-grade.
- A meta-tool pair fronts the tool registry. Rather than declaring every
debrief-calctool inpackage.jsonand churning it as the catalogue grows, two tools —listToolsandrunTool— expose the dynamic registry. The tool surface stays two entries wide no matter how many analysis tools sit behind it. - Engine bump to VS Code
^1.99.0, the release where agent-mode tool integration actually landed. - A known limitation, surfaced honestly: the LM Tools API doesn’t tell the extension which model is answering, so the multi-model comparison is operator-annotated rather than captured automatically. Worth recording, not worth hiding.
- Deliberately throwaway. The product of this spike is knowledge for its offline successor, not shipped code — so it is self-contained, disposable, and instrumented to teach rather than to last.
What a Turn Actually Looks Like
The centrepiece is styling the open plot from chat. Here is the whole round-trip for one utterance — “colour the submarine track red” — with a track selected on the map.
First, Copilot grounds the request. It calls debrief_summarizeCurrentPlot, which returns a thinned inventory — feature names, types, platforms, time spans, counts, but no geometry — so the model can resolve “the submarine track” to a real feature id rather than guessing:
{
  "plotId": "stac://store-1/items/alpha-day1/item.json",
  "title": "Exercise Alpha — Day 1",
  "features": [
    { "id": "track-1", "name": "HMS Nelson", "type": "TRACK", "platform": "HMS Nelson",
      "timeSpan": { "start": "2026-03-01T00:00:00Z", "end": "2026-03-01T06:00:00Z" }, "pointCount": 120 }
  ],
  "truncated": false,
  "approxTokens": 302
}
Then it discovers the tool via debrief_listTools (which projects the live registry with a derived mutating flag), and proposes a debrief_runTool call. Because set-track-color is a mutating tool, the confirmation gate fires — and the body is deliberately plain language, never raw JSON:
Run Set Track Color on Exercise Alpha — Day 1
Set Track Color will modify Exercise Alpha — Day 1.
- Target: HMS Nelson
- color: red
The change is applied to the open editor and left unsaved (undo/revert to discard).
On approval, the tool re-validates the id and params against the live registry (an invented tool id is rejected before any Python process spawns), runs through the shared calcService.executeTool path, and applies the result to the open editor’s features while marking the session dirty. It omits the Tools-panel’s disk write. The map shows the track in red immediately; the plot is dirty; nothing was written to disk from the chat turn. That last clause is the one the whole design turns on.
The contrast cases are just as important. An analytical tool — “run speed-filter below 5 kts” — auto-runs with no confirmation and routes its result to the Results panel. And the fail-safes refuse rather than guess: “colour the track red” with nothing selected returns “Nothing is selected… (I will not guess)”; an invented tool id returns a corrective message and never spawns Python; no plot open returns “Search the catalog and open a plot first.”
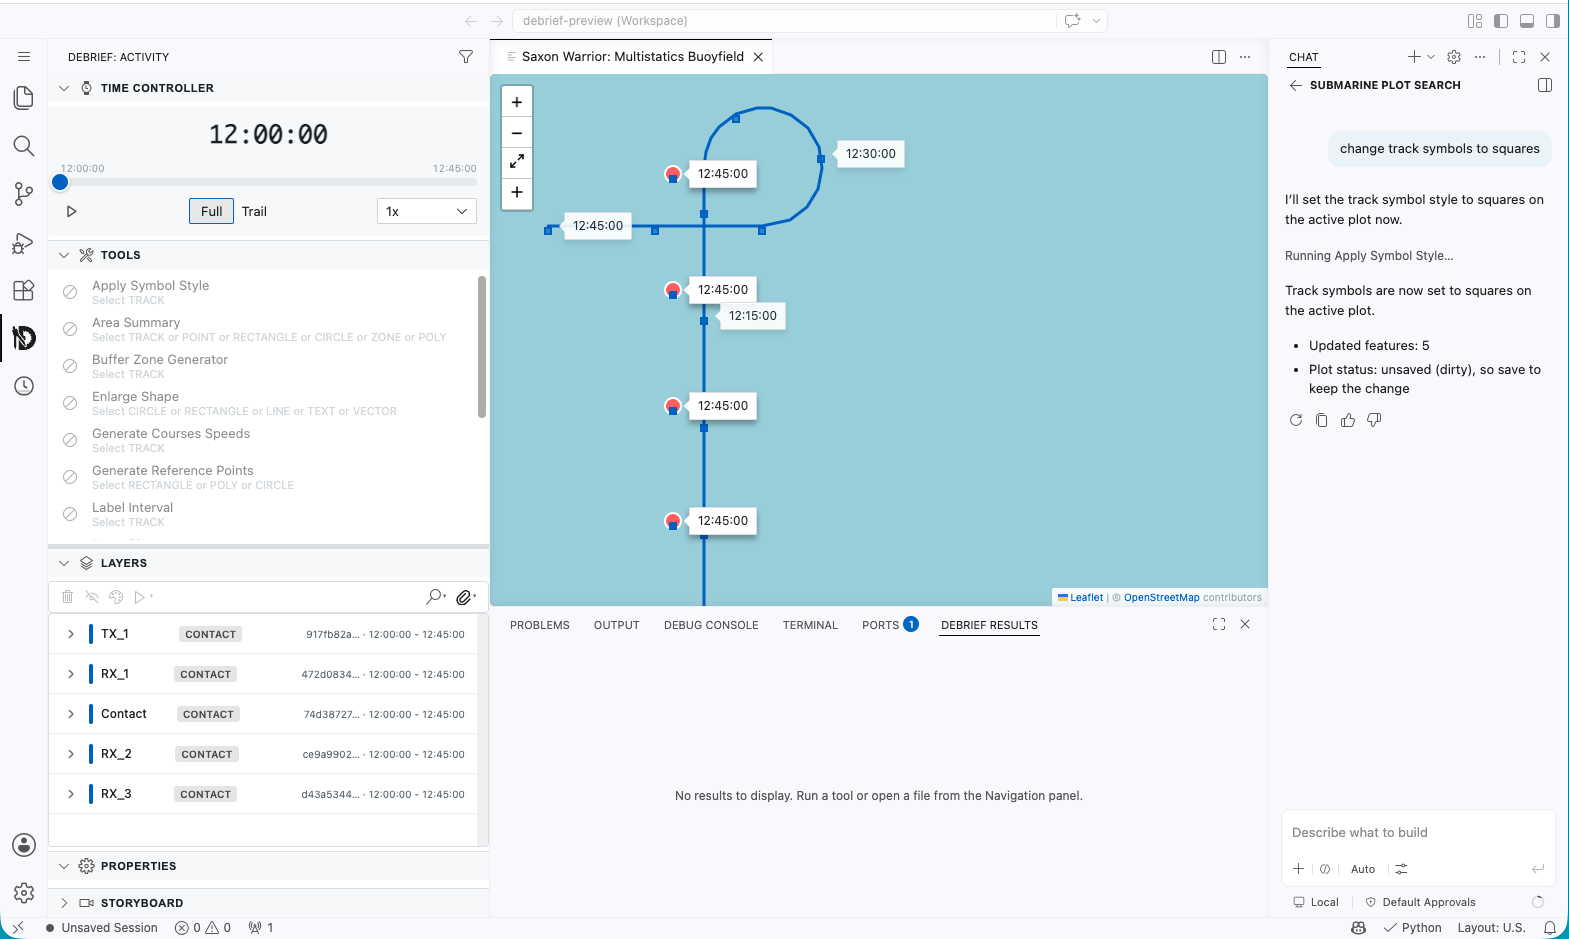
And it isn’t hypothetical — here it is running live in the browser-based preview. Asking “change track symbols to squares” runs the styling tool and reports back honestly: five features updated, plot dirty (unsaved), save to keep the change — the dirty-only, nothing-written-to-disk path, in a real Copilot session:
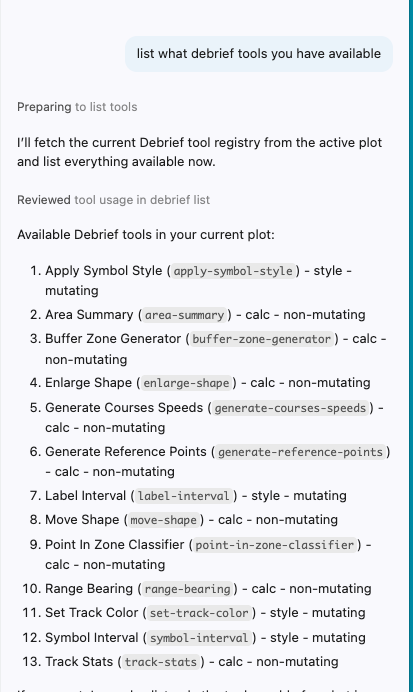
And asking “list what debrief tools you have available” returns the live registry — each tool tagged with its category and whether it mutates the plot, exactly as debrief_listTools projects it:
What We Learned
The findings report answers six questions. The short version:
Tool granularity — the hybrid split is the right shape. Two static, purpose-built tools (searchPlots, summarizeCurrentPlot) carry rich descriptions so the model routes to them in a single call, while the listTools/runTool meta-pair keeps the contributed surface two entries wide no matter how many Python tools sit behind it. A new debrief-calc tool becomes usable from chat the moment it registers — no package.json churn. The cost is that runTool must re-validate the model’s tool id and params itself, because the model can hallucinate ids; that validator, rejecting an invented tool with a corrective message and no Python spawn, is what makes the meta-pair safe.
Context sufficiency — the thinned summary was enough, cheaply. Names, types, platforms, time spans and counts let the model resolve “the submarine track” to a real id. Because the summary reports feature counts rather than geometry, cost scales with the number of features, not track length. The one gap: there’s no per-feature spatial digest yet, so “the northern track” isn’t answerable from the summary alone. Noted for E13.
Confirmation friction — the plain-language gate is the right default, and over-gating is the acceptable failure mode. Classification is category-driven (calc/snapshot auto-run; everything else gates), because a registry entry doesn’t carry a tool’s result type until it runs. An unknown-category tool is therefore over-gated — an extra confirmation — rather than under-gated. The real backstop is an invoke-time guard: a mutating result from a tool the gate classified as analytical throws rather than applying an unconfirmed edit.
Transferability — high, and it’s the deliverable that outlives the spike. Search, execution, and the safety divergence are all Copilot-agnostic TypeScript. The offline panel reuses searchCatalog, summarize, plotContext, applyChatEdit, the registry, and the telemetry seams unchanged — only the transport (Copilot LM tools versus a local-model loop) gets replaced.
What the Models Actually Did
The two questions I most wanted real numbers for — does the model pick the right tool, and does the model matter? — are the ones that decide whether an offline panel is feasible at all. So I ran the routing probe for real: the four tool schemas plus the eight scenario prompts, fed to two models (Claude Haiku 4.5 and Sonnet 5) with the domain-priming file toggled on and off. It records which tool the model reaches for. The results were more interesting than a pass/fail number, and they changed how I think about the problem.
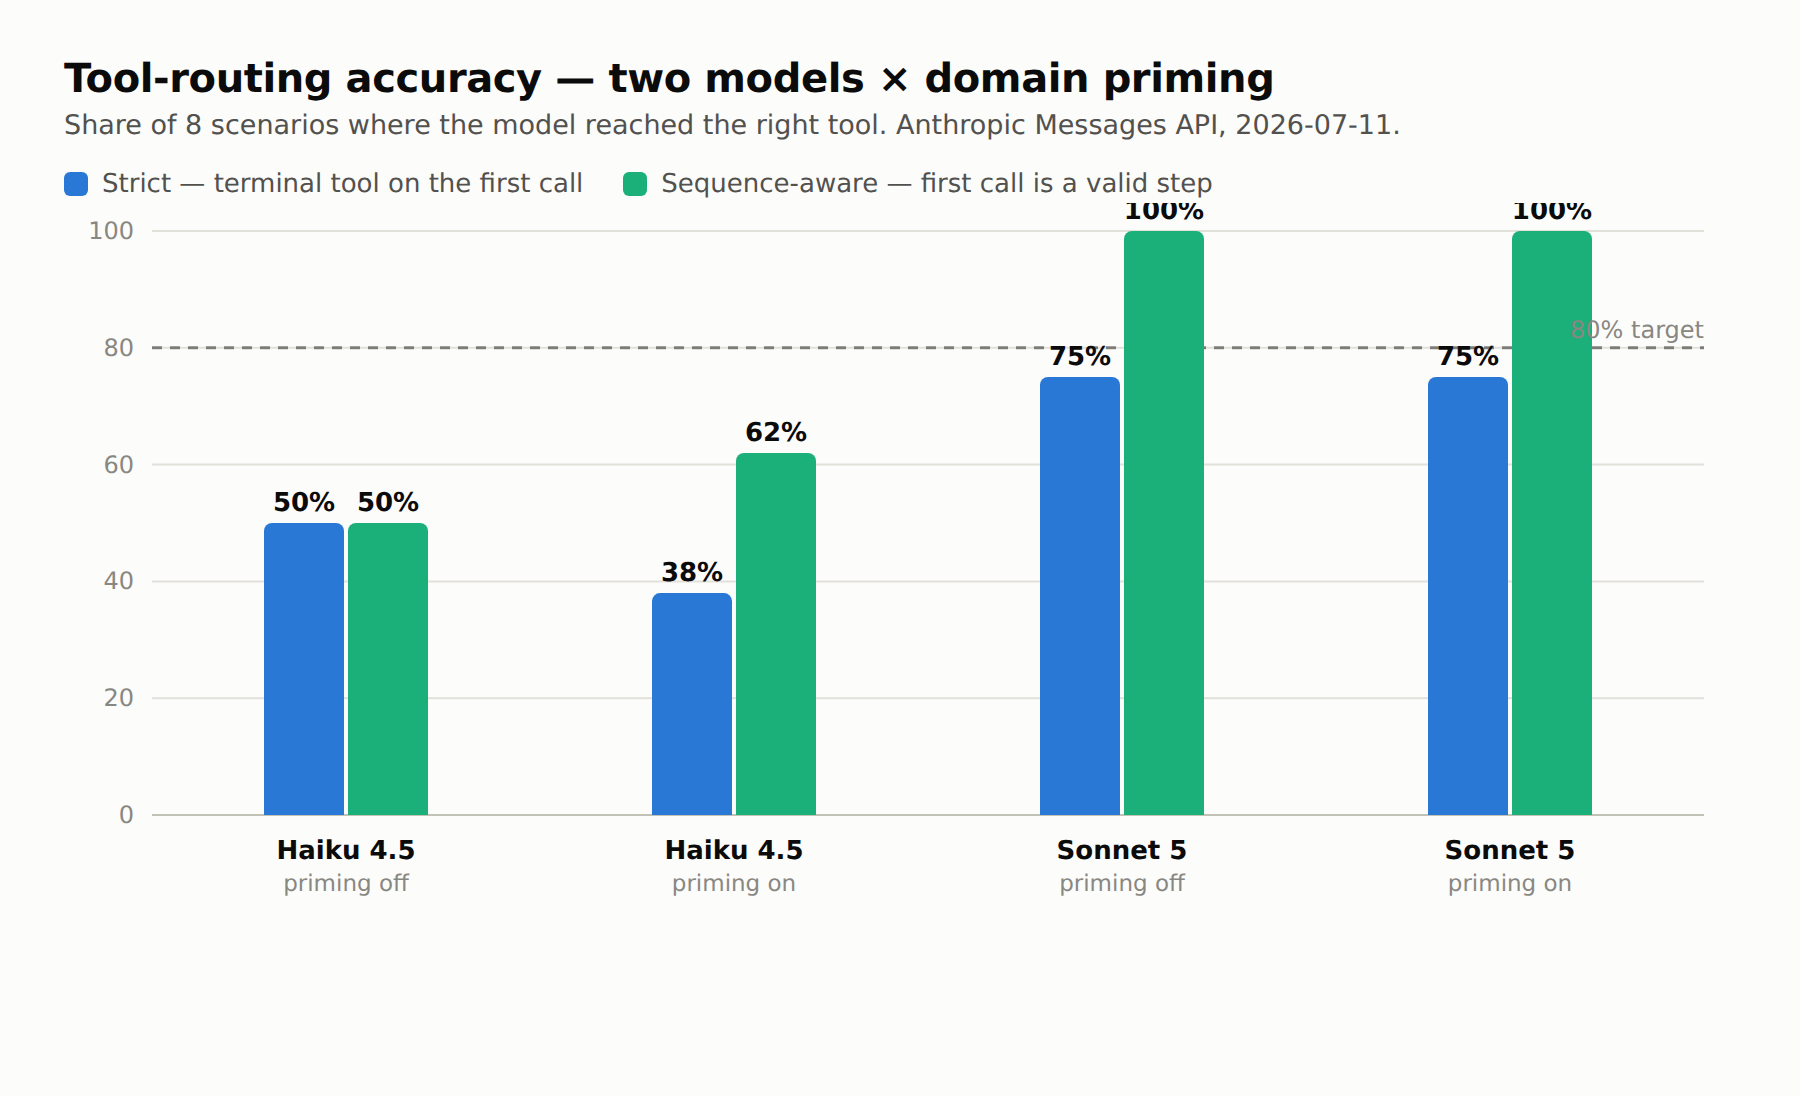
The model tier mattered more than anything I could write in a prompt. Sonnet 5 called a tool for every discovery, summary and search request; Haiku 4.5 did not. Three of Haiku’s misses were no tool call at all — asked “what’s in this plot?” or “list the tools”, it answered in prose instead of invoking the tool. That’s the finding that reframed the whole exercise for me: in a tool-driving context, the dangerous failure isn’t picking the wrong tool — it’s a helpful-sounding paragraph where an action should have been. A weaker model doesn’t misfire so much as decline to fire. For the offline/local-model target, capability-to-actually-invoke is the dominant variable, ahead of any prompt scaffolding.
“Did it route correctly?” turned out to be the wrong question. Two of the eight scenarios — “colour the submarine track red”, “run speed-filter on the selection” — aren’t single calls at all. The right behaviour is a sequence: summarise to find the track, list the tools, then run. Sonnet’s only two “misses” were it correctly calling summarizeCurrentPlot or listTools first — grounding before acting, exactly what a careful agent should do. My probe scored the first call against the terminal tool, so it marked that discipline as wrong. Re-scored to credit a valid next step, Sonnet never actually mis-routed. The lesson: an agent that decomposes a request into steps has to be evaluated at the level of the trajectory, not the first token. A single-shot accuracy number quietly punishes the behaviour you most want.
Priming shaped strategy, not just vocabulary — and my cheap probe lied about it in an instructive way. On the naive score, adding the instructions file lowered Haiku’s accuracy (50% → 38%), which looked like an argument against shipping it. But when I looked at what changed, priming was pushing the model toward grounding-first — summarising before editing, listing before running — precisely the convention the file teaches. The single-shot probe penalised the improvement. Re-scored for the sequence, priming helped (50% → 62%). So the honest reading is: the domain-priming file demonstrably steers which tool the model reaches for first, toward the instructed pattern — a real, observed effect — but proving it improves end-to-end success needs a multi-turn harness that runs each tool call and scores the whole path. Instrument first; then interrogate the instrument, because the cheap version will mislead you in the direction of your own metric.
None of this needed a human sitting in Copilot Chat — it’s an automated, repeatable measurement, and it’s wired to run nightly once a key is present. That matters for a spike whose whole point is to hand E13 numbers instead of impressions.
Numbers, Not Vibes
Because the summary is what a local model has to swallow before it can act, its token cost is the number that decides whether an offline panel is even viable. The token-budget probe measured the shipped summariser over representative plot sizes:
| Plot | Features | Listed | Truncated | approxTokens |
|---|---|---|---|---|
| Small (3 tracks) | 8 | 8 | no | ~302 |
| Medium (12 tracks) | 32 | 32 | no | ~1,010 |
| Large (40 tracks) | 100 | 100 | no | ~3,064 |
| Very large (250 tracks) | 250 | 200 | yes | ~8,189 |
A typical tens-of-features plot sits comfortably inside even a 4k context window, leaving ample room for conversation. A very large plot approaches an 8k budget on the summary alone — which is exactly where the 200-feature inventory cap and the truncated: true flag earn their keep: they bound the worst case rather than letting it grow unbounded, and tell the model the list is partial so it can narrow scope instead of reasoning over a silently-cut list. The implication for E13: a 4k local model is viable for the common case with the cap; an 8k+ model handles the full ceiling.
By the Numbers
| VS Code unit tests passing | 896 |
| New Copilot tests | 48 |
| Scripted-transcript scenarios (SC-002 gate) | 8 |
| Tests failed | 0 |
| Disk writes from a chat turn | 0 |
The whole Debrief side of the boundary is verified with no human and no LLM in the loop. The 48 Copilot tests plus an eight-scenario transcript replay — five happy-path, three fail-safe, run as canned tool calls — are the correctness gate, and they exercise the production code path: the no-disk-write invariant, the dirty-marking, the “decline applies nothing” guarantee, and the pre-dispatch rejection of invalid tool ids are all asserted against the real runTool invoke path.
Lessons Learned, and the Honest Gaps
Three things blocked or bent, and I’d rather record them than bury them.
Model identity is invisible to the tool. The LM Tools API doesn’t tell the extension which model is answering, so inside Copilot the multi-model comparison would have to be operator-annotated. The spike sidesteps that by giving the routing probe its own model choice, which is how it produced the numbers above without ever needing to read Copilot’s picker. Worth recording as a limitation of the in-Copilot path, not of the measurement.
Two verification layers are deferred. Real-Python integration needs a provisioned debrief-calc interpreter, and the extension-host vscode.lm.invokeTool layer needs an Electron download that returned HTTP 403 in the cloud build session. Both are honestly deferred with written acceptance criteria for a follow-up on a properly-provisioned runner. The stated correctness gate — the transcript replay — is green, and the key invariants are proven at the unit layer against the production path.
Live Copilot screenshots came late, and corrected me. I’d written this section claiming Copilot Chat couldn’t run in the browser preview at all — and then it did, driving the tools exactly as designed (the two shots above are from that session, unretouched). The lesson landed on me as much as the tooling: the automated replay is still the gate because Copilot Chat can’t be Playwright-driven in CI, but “can’t demo it” was too strong. What I won’t do is fabricate a screenshot — every picture here is either a real session or a chart of reproducible numbers.
One more, filed as a finding rather than a fix: the Debrief editor is a webview custom editor with app-managed session state, not VS Code’s native undo stack, so “single undo” maps to the session revert mechanism. A declined or failed chat edit leaves the plot byte-identical because nothing is applied — that much is guaranteed and unit-proven. Whether an applied-but-unsaved chat edit reverts in a clean single step is the invariant the deferred extension-host layer is designed to exercise, and a gap the offline panel will need to close.
What’s Next
The recommendation to E13 is to adopt this tool surface as the contract for the offline NL panel. The static-plus-meta split, summarise-before-edit grounding, the plain-language confirmation gate, and the dirty-only apply all transfer. Three items to close first: a per-feature spatial digest in the summary, the single-step-revert verification, and — the one the routing numbers demand — a sequence-aware probe that runs each tool call and scores the whole trajectory, so the model and priming comparisons are measured on the multi-step intents that actually matter, not just the first token. The single-shot probe is a good smoke test; it’s the wrong ruler for the questions we care about most.
Driving it live already paid off. Asking to “add a buffer to the Contact track” with nothing selected got refused — correctly, the fail-safe working — but it exposed a real gap: the tool could only operate on all features or the live map selection, so a plainly-named track couldn’t be targeted without a manual click, even though the model knew exactly which feature it was. So the tool now takes featureNames/featureIds: “buffer the Contact track” resolves the name to its id and runs, with unknown or ambiguous names reported rather than guessed. That’s the spike doing its actual job — a live session turning a plausible design into a concrete improvement the offline panel will inherit.
The throwaway code did its job. The findings, the token numbers, the live session, and the tool boundary are what carry forward.