What We Built
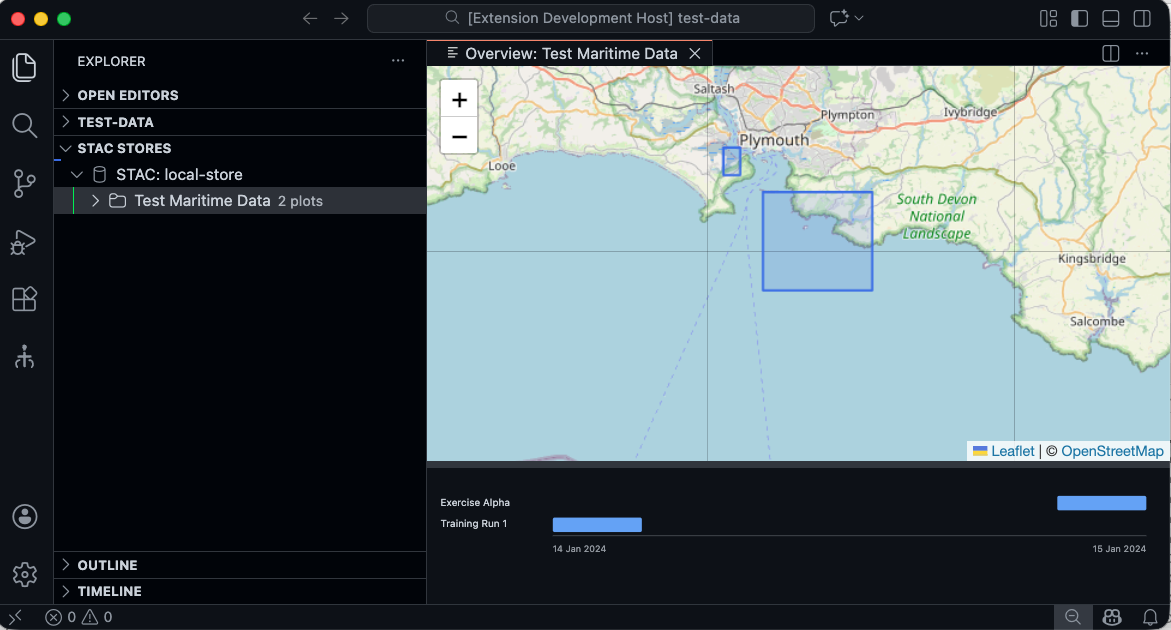
The catalog overview panel turns a STAC directory into a navigable spatial-temporal index. Double-click a catalog node in the STAC Stores tree view, and VS Code opens a read-only panel showing two synchronized views: a Leaflet map with bounding box rectangles for every item, and an SVG timeline with horizontal bars representing temporal spans.
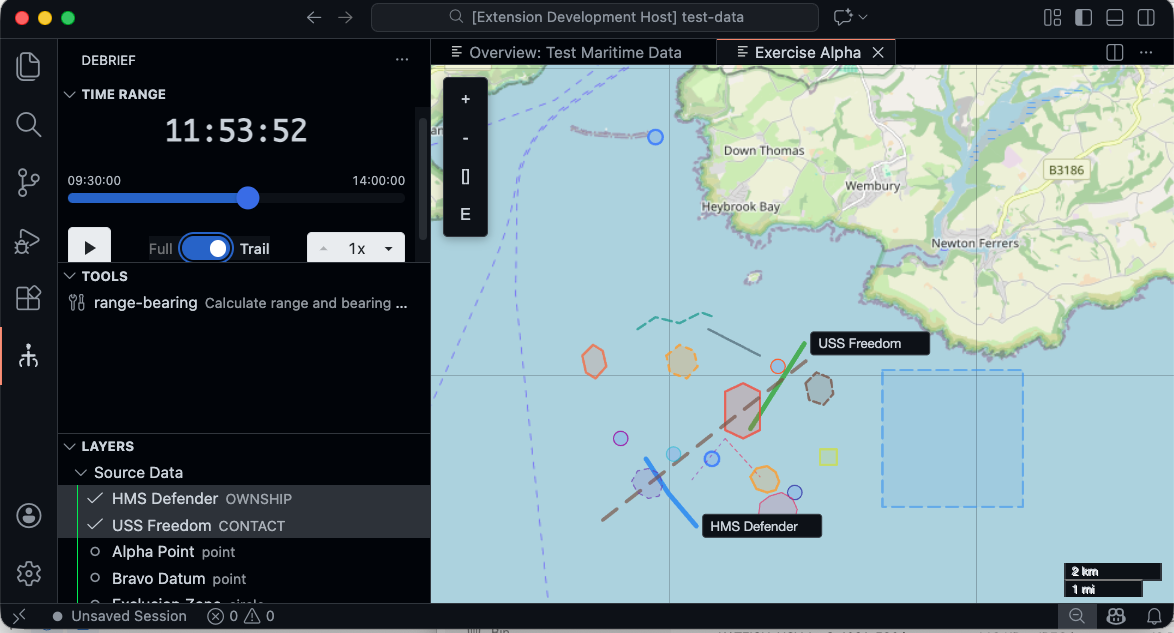
Double-clicking an item opens the full plot view with tracks, layers, and time controls:
The component lives in shared/components/ as a reusable React element, tested in Storybook with 11 stories covering nominal cases and edge conditions (empty catalogs, missing bbox, missing temporal metadata). The panel integrates into VS Code as a WebviewPanel, using the same message-passing pattern as the existing plot view.
How It Works
The architecture keeps concerns separated: the React component handles all rendering and layout logic, receiving catalog data as props. The VS Code extension provides a thin wrapper that manages the panel lifecycle, retrieves item metadata via stacService.listItems(), and bridges the webview’s double-click messages back to the “open plot” flow.
The map uses the same Leaflet instance configuration as the plot view, so it feels familiar. The timeline is hand-rolled SVG—rectangles for time ranges, circles for single-point temporal markers, and graceful fallback labels when metadata is absent.
A horizontal drag bar lets users resize the split between map and timeline. The ratio persists across sessions via VS Code’s Memento API, so analysts can save their preferred proportion.
Decisions and Trade-offs
Shared component, not a custom editor provider. STAC catalogs are directories, not files. CustomReadonlyEditorProvider requires backing documents and would have forced a virtual URI workaround. WebviewPanel is clearer about representing multi-file structures.
Lightweight metadata loading. Rather than reading full GeoJSON assets, we extract just bbox, start_datetime, end_datetime, and datetime from each item.json. This keeps the panel responsive even with hundreds of items. The trade-off is that we don’t show asset previews—the overview is intentionally aggregate, not detailed.
Overlapping timeline bars by default. Items with overlapping temporal ranges are rendered in a single row. This is compact and shows temporal density clearly, but can occlude labels. We considered auto-stacking (separate rows per item) but found it consumed too much vertical space for typical catalogs. The Storybook knobs let us test both approaches for different data distributions.
Offline rendering as default. Bounding box rectangles and timeline bars render without map tiles. If you’re disconnected, you still get the structure. The tile layer is additive—it loads asynchronously if available, but doesn’t block rendering.
What Surprised Us
Testing revealed that many items in the wild have incomplete metadata. A plot might have a complete bbox but no start_datetime, or vice versa. Rather than hide incomplete items or throw errors, we show them with a “no time data” label on the timeline or omit them from the map view. Items remain clickable regardless.
The Storybook coverage—11 stories with different fixture configurations—caught edge cases that manual testing would have missed. One story tests an empty catalog (should show a friendly message, not crash). Another tests a single item (should still auto-fit the map, not zoom to maximum). These seem obvious in retrospect but required explicit fixtures to verify.
Tests and Acceptance
13 unit tests cover metadata extraction from item.json files, timeline bar positioning logic, and edge cases like missing fields and empty collections. The Storybook stories serve as both documentation and interaction tests—reviewers can spin up the component in isolation and verify visual behavior without spinning up the full extension.
Acceptance criteria all pass: double-click opens the panel, map shows extent, timeline shows ranges, drag bar resizes, item navigation works, styling adapts to VS Code theme, and missing metadata is handled gracefully.
What’s Next
The overview panel becomes a launchpad for catalog-level operations. Future work could add filtering (show only items from a date range or geographic region), statistics (count items, total coverage area, temporal span), or export capabilities (save the current view as a GeoJSON collection). The shared component architecture means improvements benefit both Storybook and VS Code simultaneously.
The panel is also a foundation for the aggregate analysis track. Imagine comparing two catalogs’ spatial distributions side-by-side, or querying across 100 exercises to find patterns no single analysis could reveal. That’s further down the roadmap, but the catalog overview is where that vision becomes tangible.