| Chapter 17. Scripting Cookbook | ||
|---|---|---|
 | Part IV. Reference Guide |  |
| Chapter 17. Scripting Cookbook | ||
|---|---|---|
| | Part IV. Reference Guide | |
Table of Contents
A cookbook helps users learn a programming api/language by building up a repository of snippets that implement a specific task. The Debrief Scripting Cookbook contains code snippets for some of the sample tasks that can be performed using the Scripting Perspective feature of Debrief. You can use these code snippets as building blocks to solve more complex issues.
Refer to the Debrief Scripting Tutorial to gain a higher level understanding of developing scripts in Debrief.
A lot of Debrief operations will need to loop through all loaded tracks, in a particular plot. The script below will facilitate that:
loadModule('/Debrief/Core');
loadModule('/Debrief/Annotations');
// @type org.mwc.debrief.scripting.wrappers.Plot
let plot = getActivePlot();
// @type org.mwc.debrief.scripting.wrappers.DLayers
let layers = plot.getLayers();
let tracks = layers.getTracks();
for (let count =0 ; count < tracks.length; count++)
{
  //@type Debrief.Wrappers.TrackWrapper
  let track = tracks[count];
  print(track.getName())
}
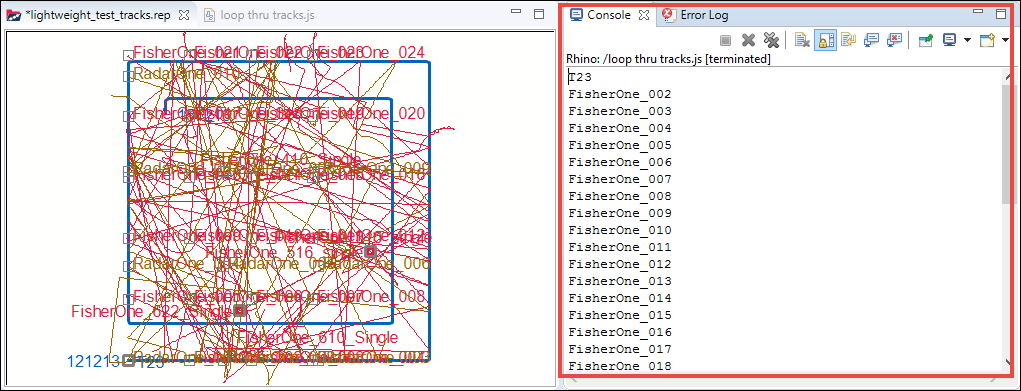
The result of the above code snippet on the file lightweight_test_tracks.rep is shown in the below screenshot. The result is the list of names of the tracks in the plot lightweight_test_tracks.rep will display in the Console.
Sometimes you may want to select the subject of a script by selecting an item in the Outline View, rather than hard-coding it. This script does that.
loadModule('/Debrief/Core');
// @type org.mwc.debrief.scripting.wrappers.Plot
let plot = getActivePlot();
//@type org.mwc.debrief.scripting.wrappers.Outline
let outline = plot.getOutline();
let selectedObjects = outline.getSelection();
print(selectedObjects);
let count;
for (count =0 ; count < selectedObjects.length; count++ )
{
  print(selectedObjects[count].getName());
}
if(selectedObjects.length == 0)
{
 print("Please select one or more items in the Outline View");
 exit(0);
}
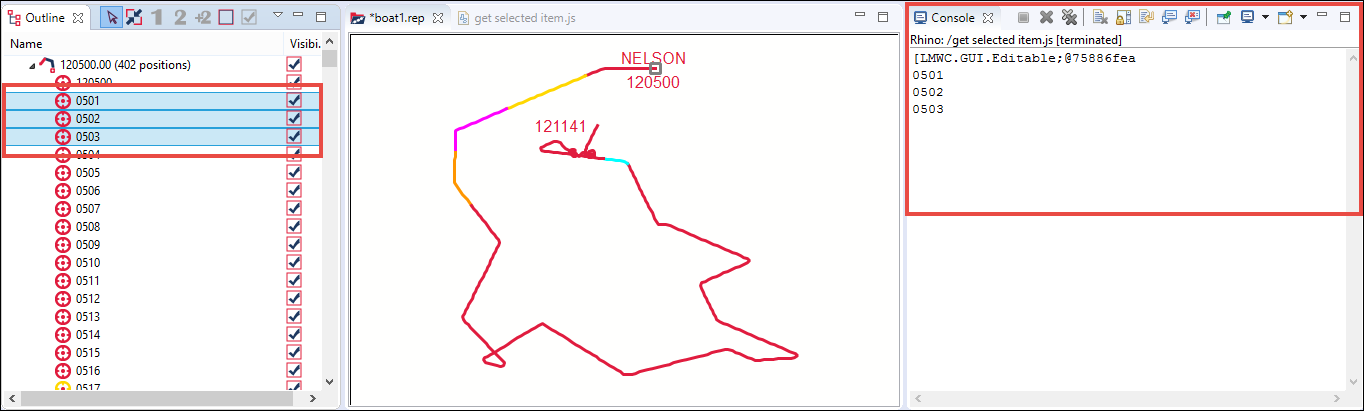
The result of this script when it is run on the file boat1.repis shown in the below screenshot. The selected items, in the outline view, in this example are positions 0501, 0502, and 0503.
When you are analysing a track and moving forward through the scenario, you may want to retrieve the current time of the scenario to perform some calculation. The below script addresses this need:
loadModule('/Debrief/Core');
loadModule('/Debrief/Annotations');
// @type org.mwc.debrief.scripting.wrappers.Plot
let plot = getActivePlot();
// @type MWC.GenericData.HiResDate
let currentTime = plot.getTime();
print(currentTime.getDate());
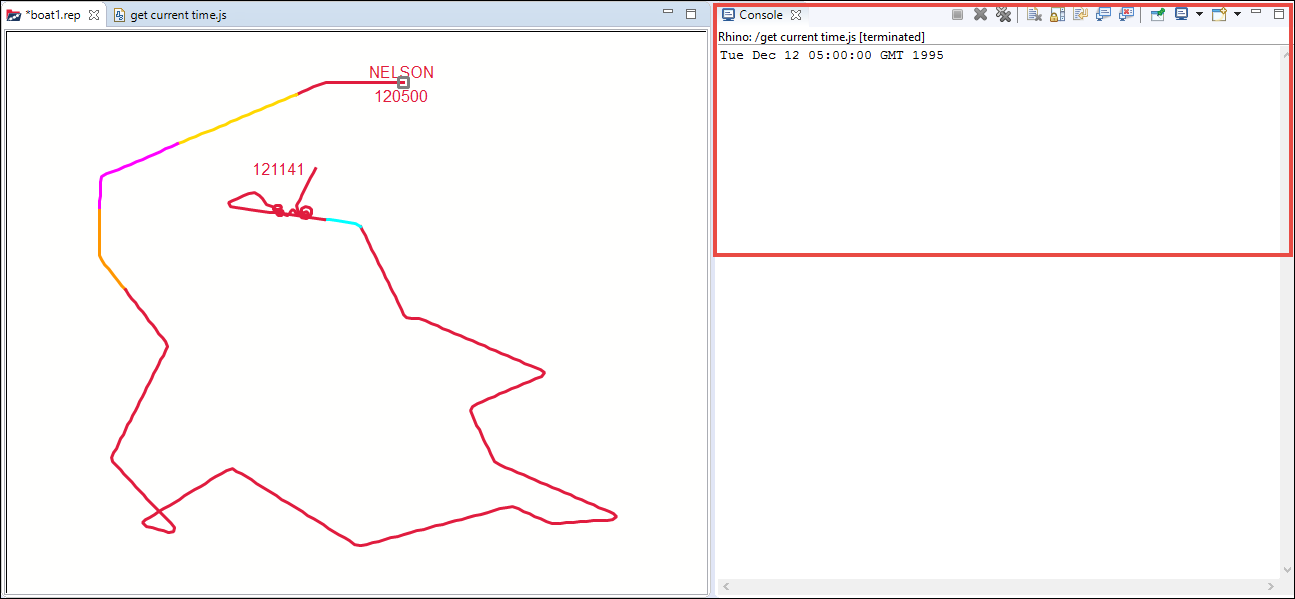
The result, the current time of the scenario, of the above code snippet on the file boat1.rep is shown in the below screenshot. The current time of the scenario will display in the Console:
You may, at times, want to retrieve the start and end time bounds of a plot, possibly to set the axes on a graph. The below script gets the start and end time bounds of a scenario:
loadModule('/Debrief/Core');
// @type org.mwc.debrief.scripting.wrappers.Plot
let plot = getActivePlot();
//@type MWC.GenericData.TimePeriod
let period = plot.getTimePeriod();
print(period.getStartDTG().getDate());
print(period.getEndDTG().getDate());
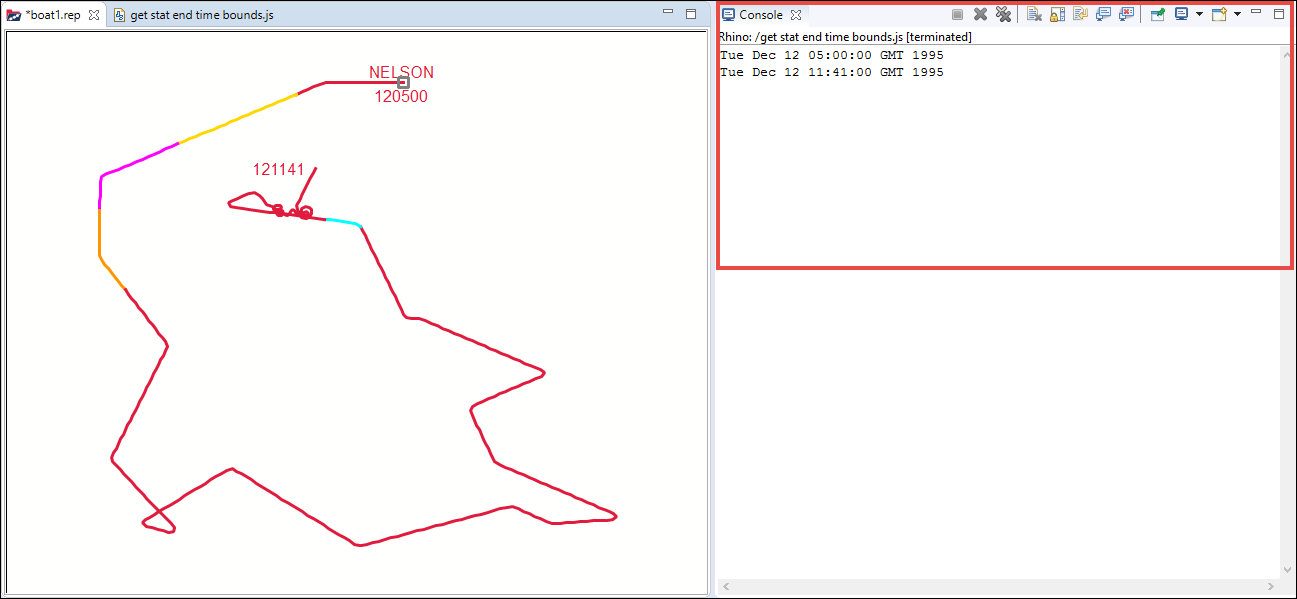
The result of this script, i.e, the start and end time bounds of the scenario, on the file boat1.rep is shown in the below screenshot. The result will display in theConsole:
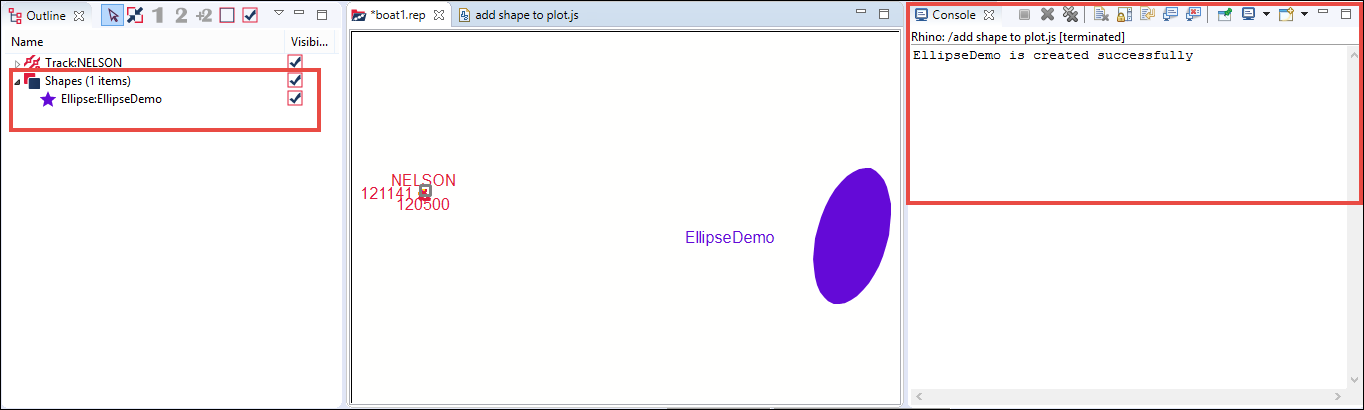
You can add value to a plot by adding shapes to it. You can use shapes, in a plot, to represent a wide range of real world entities. Also shapes can be organised in layers. The below script demonstrates creating a layer named Shapes, creating the shape ellipse named EllipseDemo, defining the position of the shape EllipseDemo, adding the newly created shape (EllipseDemo) to the newly created layer (Shapes), setting the color of the shape, and displaying the output message “EllipseDemo is created successfully” in the Console.
loadModule('/Debrief/Core');
loadModule('/Debrief/Shapes');
loadModule('/Debrief/Spatial');
// get active plot
// @type org.mwc.debrief.scripting.wrappers.Plot
let plot = getActivePlot();
//@type org.mwc.debrief.scripting.wrappers.DLayers
let layers = plot.getLayers();
//create color
let purple =  createColorRGB(100, 10, 215) ;
// @type MWC.GUI.Layer
let shapeLayer = layers.createLayer("Shapes");
layers.add(shapeLayer );
// prepare data necessary to create ellipse
// @type MWC.GenericData.WorldLocation
let ellipseLoc = createLocation(21,-10, 0);
// @type MWC.GenericData.WorldDistance
let wdDistance1 = createDistance(200.5, KM) ;
// @type MWC.GenericData.WorldDistance
let wdDistance2 = createDistance(100.5, KM) ;
// @type Debrief.Wrappers.ShapeWrapper
let myecllipse = createEllipse(ellipseLoc, 15.3, wdDistance1,
    wdDistance2, "EllipseDemo", purple);
myecllipse.getShape().setFilled(true);
shapeLayer.add(myecllipse)
print(myecllipse.getName() + " is created successfully")
The result of the script on the file boat1.rep is shown in the screenshot below. The Outline view will display the newly added layer Shapes and the shape EllipseDemo.
Debrief supports a variety of file types. With the added advantage of scripting in Debrief, you will be able to handle new or rare file types also.
loadModule('/System/Resources', false);
loadModule('/Debrief/Core'); // date
loadModule('/Debrief/Spatial'); // location
loadModule('/Debrief/Tactical'); // for plot, duration, date
// get project instance, in order to refer to a file
// @type org.eclipse.core.resources.IProject
var project = getProject("sample_data");
if (!project.exists())
{
  print("Can't find project");
  exit(0);
}
// to get this script work , please choose CSV_EXCHANGE_SAMPLE.csv file
// from other_formats folder
// @type org.eclipse.ease.modules.platform.IFileHandle
let pathToSelectedFile = showFileSelectionDialog("workspace://",1,
    "Select File", "Select your File that has track information") ;
// create a file within the project
var file = openFile(pathToSelectedFile);
if (!file.exists())
{
  print("Can't find file");
  exit(0);
}
var track = null;
// ok, now loop through the file contents
var nextLine;
var ctr = 0;
while ((nextLine = readLine(file)) != null)
{
  ctr++;
  if (ctr > 2)
  {
    /**
     * Note: format looks like this: Two header lines,
     * then rows of CSV entries.
     * # UK TRACK EXCHANGE FORMAT, V1.0 #
     * Lat,Long,DTG,UnitName,CaseNumber,Type,Flag,Sensor,
       MajorAxis,SemiMajorAxis,SemiMinorAxis,Course,Speed,Depth,
       Likelihood,Confidence,SuppliedBy,Provenance,InfoCutoffDate,
       Purpose,Classification,DistributionStatement
     * 22.1862861,-21.6978806,19951212T050000Z,NELSON,D-112/12,
       OILER,UK,S2002,1.0,0.5,0.5,269.7000,2.0000,0.0,Remote,Low,
       UNIT_ALPHA,NELSON,19951212,For
     * planning,PUBLIC,"Quite a content."
    */
   var partsOfStr = nextLine.split(',');
     if (track == null)
     {
        // track not created yet. Go for it.
        track = createTrack(partsOfStr[3])
     }
     // location
     let dLat = parseFloat(partsOfStr[0]);
     let dLong = parseFloat(partsOfStr[1]);
     let location = createLocation(dLat, dLong, 0);
     // dtg components
     let dtgStr = partsOfStr[2];
     let yrs = dtgStr.substring(0, 4);
     let mons = dtgStr.substring(4, 6) - 1;
     let days = dtgStr.substring(6, 8);
     let hrs = dtgStr.substring(9, 11);
     let mins = dtgStr.substring(11, 13);
     let secs = dtgStr.substring(13, 15);
     // date object
     let dtg = createDateCalendarFormat(yrs, mons, days, hrs, mins, secs);
     // course and speed
     let course = partsOfStr[11];
     let speed = partsOfStr[12];
     // create the fix
     // @type Debrief.Wrappers.FixWrapper
     let fix = createFix(dtg, location, course, speed);
     // store the fix
     track.addFix(fix);
  }
}
if (track == null)
{
  exit(0)
}
// ok, now add the new track to the plot
let plot = getActivePlot();
//@type org.mwc.debrief.scripting.wrappers.DLayers
let layers = plot.getLayers();
layers.add(track);
layers.fireModified();
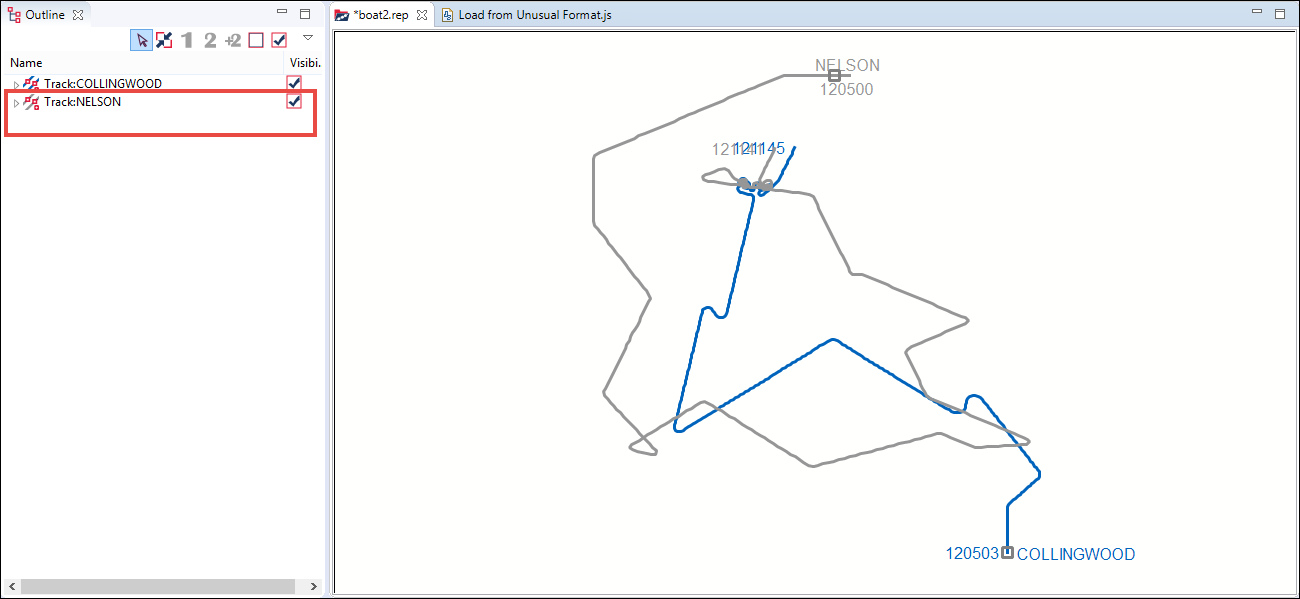
We will run this script on the file boat2.rep which has one track COLLINGWOOD. When prompted select the file CSV_EXCHANGE_SAMPLE.csv file, from other_formats folder, which has one track NELSON. After running the script, the file boat2.rep will have two tracks NELSON and COLLINGWOOD, which will update in the Outline view and the Plot Editor. The result is shown in the below screenshot:
Scripting, in Debrief, is not only useful for reading in data, but it is also useful in producing outputs of new derived datasets. This script will help you do that:
loadModule('/System/Resources', false);
loadModule('/Debrief/Core'); // date
loadModule("/System/UI", false); // for the input dialogs
// get project instance
var project = getProject("sample_data");
if (!project.exists())
{
 print("Can't find project");
 exit(0);
}
// @type org.mwc.debrief.scripting.wrappers.Plot
let plot = getActivePlot(); // get the current plot
if (plot == null) // did we find a Debrief plot?
{
 print("There is no active plot");
 exit(0);
}
//@type org.mwc.debrief.scripting.wrappers.DLayers
let layers = plot.getLayers(); // get the layers for the plot
let lNames = layers.getTrackNames(); // get a list of layer names
let choice = showSelectionDialog(lNames,
  "Which track?","Choose track to export"); // let the user select a name
if (choice == null) // did user select something?
{
 print("You must choose an option");
 exit(0);
}
// create a file within the project
var file = openFile("workspace://sample_data/other_formats/tutorial_"
+ choice + "_export.csv", WRITE, true);
if (!file.exists())
{
 print("Can't create file");
 exit(0);
}
writeLine(file, ";; elapsed (secs), course rate (degs/sec)");
let track = layers.findTrack(choice); // try to get the selected layer
if (track == null) // did we find it the annotations layer?
{
 print("Layer was not found");
 exit(0);
}
var ctr = 0;
let fixes = track.getPositionIterator(); // to loop through positions
var lastCourse = null;
var lastTime = null;
var firstTime = null;
while (fixes.hasMoreElements()) // while there are more elements
{
 // @type Debrief.Wrappers.FixWrapper
 let fix = fixes.nextElement(); // get the next element
 let thisCourse = fix.getCourseDegs();
 let thisTime = fix.getDTG().getDate().getTime();
 if (firstTime == null)
 {
 firstTime = thisTime; // remember the start time
 }
 if (lastCourse != null)
 {
 let courseDelta = thisCourse - lastCourse;
 let timeDelta = (thisTime - lastTime) / 1000.0;
 let courseRate = courseDelta / timeDelta;
 let elapsed = (thisTime - firstTime) / 1000.0;
 let str = elapsed + ", " + courseRate;
 writeLine(file, str);
 }
 lastCourse = thisCourse;
 lastTime = thisTime;
 ctr++;
}
showInfoDialog(ctr + " lines exported", "Export to CSV");
closeFile(file);
When you run the script, in this case on boat1.rep, the dialog showing the number of lines exported will display.

The output file, in CSV format, will be saved in the sample_data folder of your Debrief installation.
At times you would want to modify all the elements in the plot that match certain criteria; instead of individually selecting elements to modify. The script below reveals all the tracks that are of a selected color, from the plot.
/**
* name: filter to only show tracks with matching color
**/
loadModule("/System/UI", false); // for the input dialogs
loadModule('/Debrief/Core'); // for plot, duration, date
/**
* function to return the unique entries in the provided list
from here
* https://coderwall.com/p/nilaba/
         simple-pure-javascript-array-unique-method-with-5-lines-of-code
**/
Array.prototype.unique = function()
{
  return this.filter(function(value, index, self)
  {
    return self.indexOf(value) === index;
  });
}
let plot = getActivePlot(); // get the current plot
if (plot == null) // did we find a Debrief plot?
{
  print("There were no active plot");
  exit(0);
}
// get the layers for the plot
//@type org.mwc.debrief.scripting.wrappers.DLayers
let layers = plot.getLayers();
let tracks = layers.getTracks();
// collate a list of symbols
var colors = [];
let len = tracks.length; // find number of tracks
if(len== 0)
{
   showInfoDialog("No tracks found", "Filter colors");
   exit(0);
}
for (var i = 0; i < len; i++) // loop through tracks
{
    let track = tracks[i]; // get this track
    let color = track.getColor(); // get the track color
    colors[i] = color; // add this color to the list
}
// find the unique list of colors
colors = colors.unique();
// ask the user which one to filter
let chosenColor = showSelectionDialog(colors,
  "Choose symbol to match","Filter to matching color");
if (chosenColor == null) // did one get chosen?
{
  exit(0); // ok, drop out.
}
// now loop through, and hide any that don't match
for (var i = 0; i < len; i++)
{
  //@type Debrief.Wrappers.TrackWrapper
  let track = tracks[i]; // get the next track
  // @type java.awt.Color
  let color = track.getColor(); // get its color
  let isVis = color == chosenColor; // does this match the chosen one?
  track.setVisible(isVis); // set visibility accordingly
}
layers.fireModified();
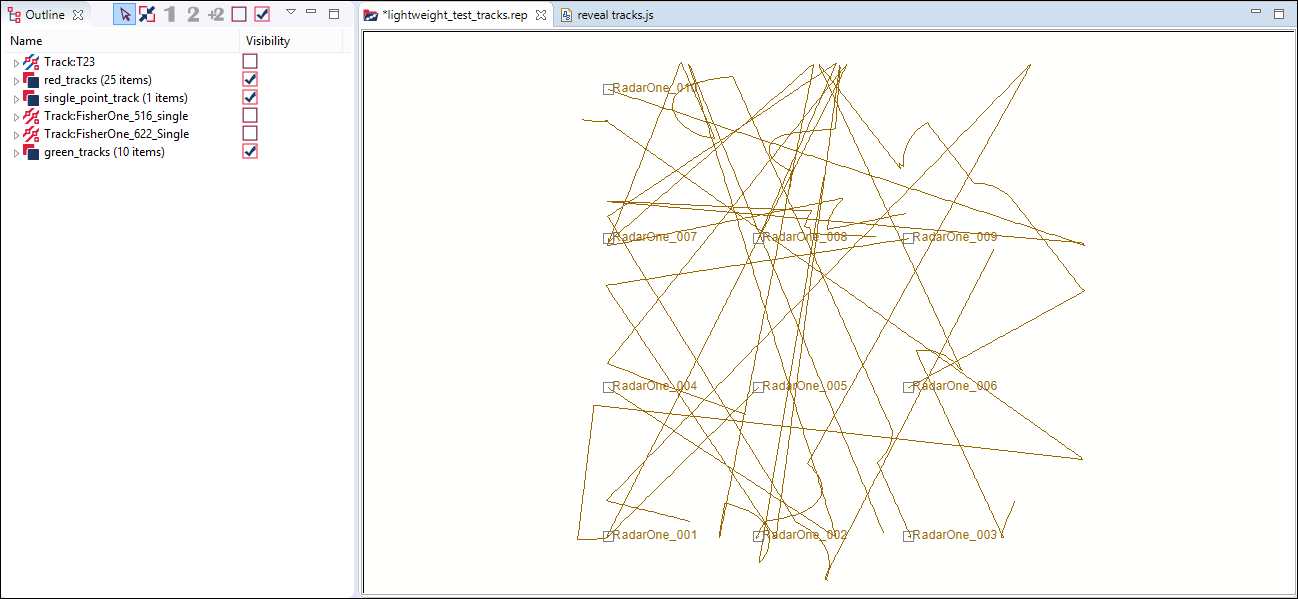
The result of the above script on the file lightweight_test_tracks.rep, showing the tracks of the color with RGB code 153,102,0, is shown in the below screenshot:
A common operation which is applied to similar tracks is converting them into lightweight tracks. On the next level would be controlling the lightweight tracks together which can be achieved by organizing them into a layer. Sometimes the presence of a characteristic, such as the use of a platform-type symbol on a track, can be used to control how to operate on tracks for other platforms of that type. This script will group all the tracks, in a plot, with matching symbol into a new layer.
/**
* name: Group all the tracks with matching symbol
 *
*/
loadModule("/System/UI", false); // for the input dialogs
loadModule('/Debrief/Core'); // for plot, duration, date
/**
* function to return the unique entries in the provided list from here:
* https://coderwall.com/p/nilaba/
       simple-pure-javascript-array-unique-method-with-5-lines-of-code
*/
Array.prototype.unique = function() {
  return this.filter(function(value, index, self) {
    return self.indexOf(value) === index;
  });
}
let plot = getActivePlot(); //get active opened plot
if (plot == null) // did we find a Debrief plot?
{
  print("No track found");
  exit(0);
}
//@type org.mwc.debrief.scripting.wrappers.DLayers
let layers = plot.getLayers(); // get the layers for the plot
let tracks = layers.getTracks();
// collate a list of symbols
var symbols = [];
let len = tracks.length; // find number of tracks
// do we have?
if(len== 0)
{
  showInfoDialog("No tracks found", "Filter symbols");
  exit(0);
}
for (var i = 0; i < len; i++) // loop through tracks
{
  let track = tracks[i]; // get this track
  let symbol = track.getSymbolType(); // get the symbol type
  symbols[i] = symbol; // add this symbol to the list
}
// find the unique list of symbols
symbols = symbols.unique();
// ask the user which one to filter
let chosenSym = showSelectionDialog(symbols,
    "Choose symbol to match","Filter to matching symbol");
if (chosenSym == null) // did one get chosen?
{
  exit(0); // ok, drop out.
}
// Then we create the new layer with the symbol name.
let newLayer = layers.createLayer(chosenSym);
/**
* now loop through, and move the track to the new layer if it matches
* with the symbol name
* */
for (var i = 0; i < len; i++)
{
  let track = tracks[i]; // get the next track
  let symbol = track.getSymbolType(); // get its symbol
  if ( symbol == chosenSym )
  {
   newLayer.add(track);
   layers.remove(track);
  }
}
layers.fireModified();
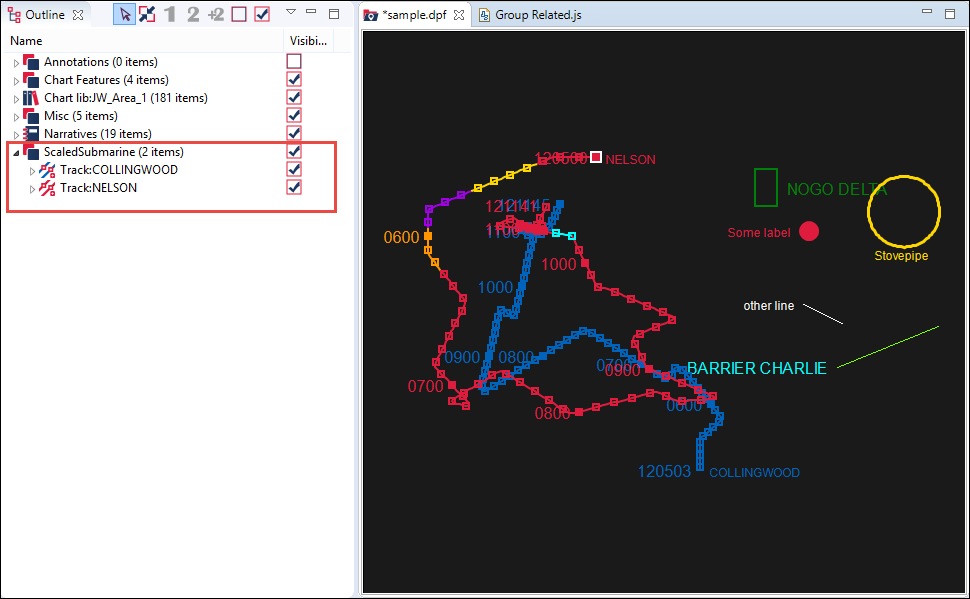
Run this script on the file sample.dpf, the tracks in the plot, NELSON and COLLINGWOOD, will be grouped under the selected symbol ScaledSubmarine and the result can be seen in the Outline View.
Scripts can be used to perform bulk tasks which would otherwise take hours of effort. This script will make all the annotations in the selected layer, in the plot, live for a particular duration of time. And this is achieved by changing the finishing time of the scenario.
loadModule("/System/UI", false); // for the input dialogs
loadModule('/Debrief/Core'); // for plot, duration, date
let plot = getActivePlot(); // get the current plot
if (plot == null) // did we find a Debrief plot?
{
  print("There is no active plot");
  exit(0);
}
let layers = plot.getLayers(); // get the layers for the plot
let lNames = layers.getLayerNames(); // get a list of layer names
let choice = showSelectionDialog(lNames, "Which layer",
      "Choose ellipse layer"); // let the user select a name
if (choice == null) // did user select something?
{
  print("You must select an option");
  exit(0);
}
let anns = layers.findLayer(choice); // try to get the selected layer
if (anns == null) // did we find it the annotations layer?
{
  print("Layer selected was not found");
  exit(0);
}
// ok, sort out the duration
let mins = showInputDialog("How many minutes?", "10",
                     "Set ellipse duration");
let duration = createDuration(mins, DUR_MINUTES);
// now loop through the layer
let numer = anns.elements(); // retrieve the elements in this layer
while (numer.hasMoreElements()) // loop through the items in this layer
{
  let item = numer.nextElement(); // get the next element
  // @type java.lang.String
  let name = item.toString(); // get the string label for the element
  if (name.startsWith("Ellipse")) // see if it starts with "Ellipse"
  {
      let start = item.getStartDTG(); // retrieve the start date
      let newTime = (start.getDate().getTime() + duration
        .getValueIn(DUR_MILLISECONDS)); // calculate the new end time
      item.setEndDTG(createDate(newTime)); // set the new end time
  }
}
layers.fireModified();
Follow the below steps to execute the script:
Drag and drop the file shapes.rep into the Plot Editor.
In the Outline view, hide all the layers except the TUAs (7 items) layer and the 7 child items (Ellipses) under it.
In the Properties view, under the section Time-Related, note the Time end of each ellipse under the TUAs will display as Unset.
Now run the script on the file shapes.rep.
When prompted, select the ellipse layer TUAs and set the duration to 30 minutes.
In the Properties view, under the section Time-Related, note the change in the Time end of each ellipse. It will display Time start plus 30 minutes (the duration set in the previous step).
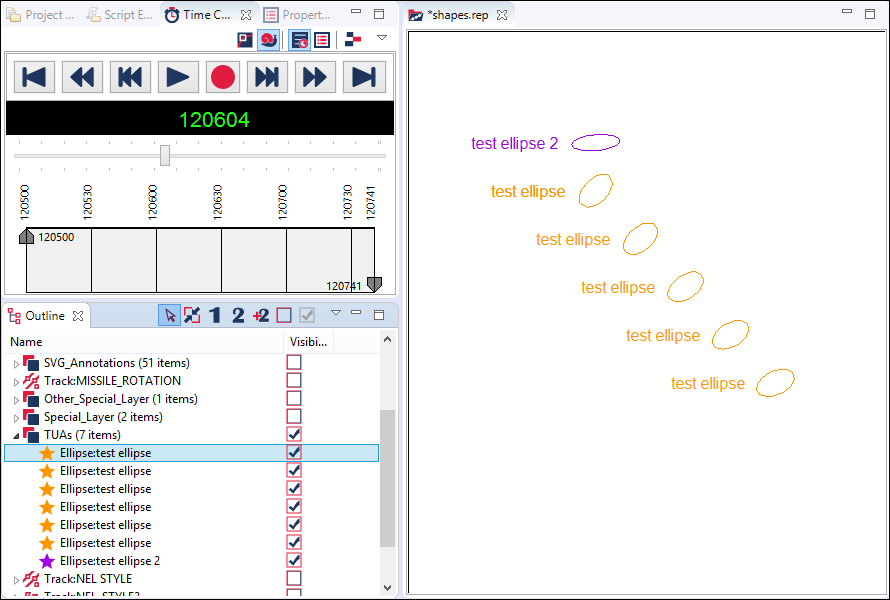
In the Time Controller, switch to Snail mode and drag the slider to 120552. You will notice that first test ellipse will display in the Plot Editor.
Continue to drag the slider. For every two seconds you move the slider, the consecutive test ellipse will display in the Plot Editor.
The result of the script is shown in the below screenshot:
As your scripting skills increase, you may want to group commonly used code snippets into utility files. This script will demonstrate how to refer to such commonly grouped script files.
Create a script file hello.js with the following code:
loadModule('/System/UI');
showInfoDialog("Hello World", "Title")
Create another script file testCall.js with the following code:
// Include must contain the project name, followed by the
// complete path. You could include the “workspace:/” tag:
include("workspace:/project/scripting/hello.js")
Note: You can copy the complete path of the workspace by navigating to Window > Preferences > Scripting > Script Locations.
As an extension, you can include functions/methods created in different files. Now create the script file sum.js.
function sum(a, b)
{
  return a+b;
}
Now let us call the scripts sum and hello in the script testCall.js.
// Include must contain the project name, followed by the complete path.
// You could include the “workspace:/” tag
include("workspace://DebriefNG/sample_data/other_formats/Scripts/hello.js")
include("workspace:/project/scripting/sum.js")
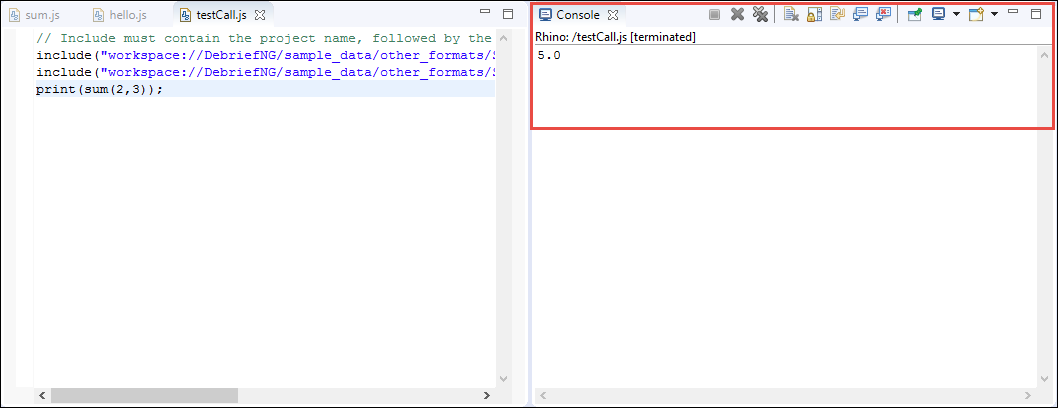
print(sum(2,3));
The script hello.js will execute first and the dialog with the message Hello World will display.
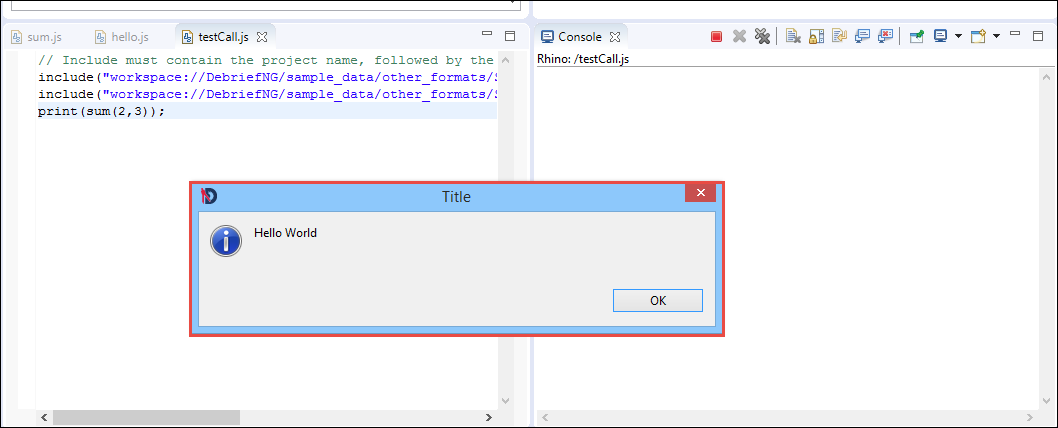
Click OK. Then the next script sum.js will execute and the sum of the two integers will be displayed in the Console.
| |  | |
| 16.8. Third Party BRT Format |  | Chapter 18. GeoTools in Debrief |