| 7.3. Viewing VPF data | ||
|---|---|---|
 | Chapter 7. External datasets |  |
| 7.3. Viewing VPF data | ||
|---|---|---|
| | Chapter 7. External datasets | |
Debrief does not pay any attention to VPF data until it loads a plot which requires the data, or until the user requests that VPF layers be added.
VPF layers are loaded into a plot using the "Create VPF Layers" button:

Yes, it's a shrunken version of NIMA's VPF logo. If VPF layers have been loaded into Debrief, their details are stored in the plot file (i.e., whether they are switched on or off, and their colour). Note that the data itself is not stored in the plot file, just the names of the layers you're using (so there's no significant increase in file size).
Once loaded into a plot configure the VPF data by switching to the . In there, open the Chart Features layer, to see the new VPF layer.
Figure 7.6. VPF Data in Outline View
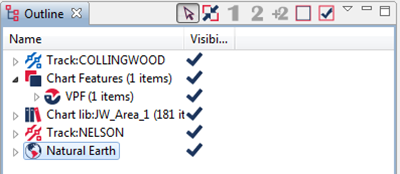
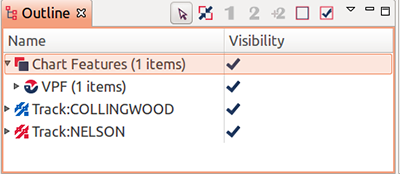
Click on the VPF layer to open it up, showing which VPF databases are currently loaded. In this example you can see that I have the VMap Level 0 (vmaplv0) data together with some Digital Nautical Chart (DNC) data. Each layer shows how many items are on that layer, and the empty check box shows that each layer is not currently visible.
Figure 7.7. Layers within Chart Features
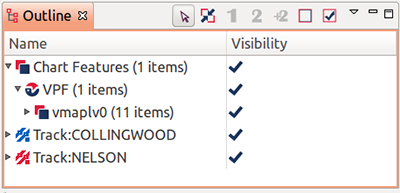
You are going to switch on coastline data first, so click open up the vmaplv0 database by clicking on the expand folder symbol. You will see the list of VMap themes listed. Later on, feel free to open them up and view the data they contain, but for now you will concentrate on the coastlines. The order of the themes may be different on your machine, this is of no concern.
Figure 7.8. List of VPF layers
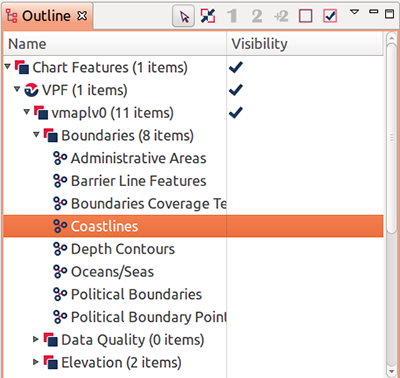
Next, open up the Boundaries theme to see which Boundaries can be plotted by VMap.
Figure 7.9. Boundaries theme
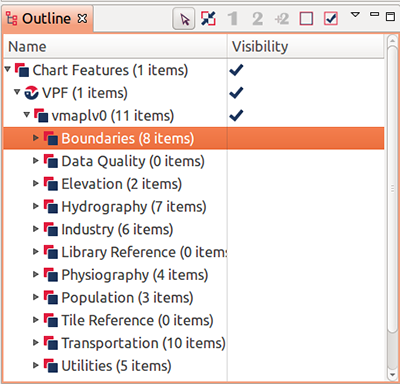
Figure 7.10. Coastlines feature
Now you are going to configure the plotting of coastlines.
Right-click on the Coastlines entry, and from the Coastlines drop-down list, select Color, and then Light Grey. Note that White is the default colour for all VPF features.
Next, right-click on the coastlines entry again, and make the coastline Visible.
Whilst we've made the Coastlines visible, the layers above it aren't, so now you make its parents visible. Right-click on the Boundaries layer and make it visible. Next right-click on the vmaplv0 layer to make that too visible.
Nothing has yet appeared on the plot, but that is because you are not current over any coastline. Now zoom out 6 times until the plot looks like that below:
Figure 7.11. First coastline
Now you can see your new coastline of Africa.
Select the Pan control from the Plot toolbar:

Now drag the plot southwards to move the view up towards Europe. Keep dragging until you have a clear view of a more familiar coastline, that of the British Isles. From this view you will add depth contours.
Figure 7.12. Coastline of British Isles

Right-click on the Depth Contours entry in the Boundaries layer and switch its colour to Grey. Also switch the Contours entry to Visible.
Depth contours will now appear:
Figure 7.13. Coastline of British Isles with depth contours
![[Note]](images/note.gif) | Note |
|---|---|
|
Note, the VMap CD-ROM gives the following description with relation to depth contours:
|
Feel free to zoom in on the data to see just how detailed the data gets (around Cowes on the Isle of Wight sections of coastline of only 200 yards length are clearly visible).
Also zoom out to view the whole of the British Isles and experiment with switching on features in other layers.
The plot below shows UK railways (from the Transportation Layer), and UK is shaded in by making the Administrative Areas (from the Boundaries Layer) visible.
Figure 7.14. Railways of British Isles
Alternatively zoom and pan across to your home, see the accuracy of your part of the coastline.
As explained earlier, when you save the VPF plot your VPF settings get saved with it. So have a go at saving your current view, exiting/re-starting Debrief then re-loading it. You should find yourself seeing the same view which you saved.
There's no doubting the volume of data available through VPF, and the VMap Level 0 database in particular. The next level down from VMap Level 0 is VMap Level 1; which contains approximately 10 times more detailed information.
How much of it is of use is more subjective though, so it's best to lead your strategy for its use by your analysis requirements.
| |  | |
| 7.2. VPF data |  | 7.4. Configuring VPF defaults |