| 3.8. Using the Grid Editor | ||
|---|---|---|
 | Chapter 3. Manipulating track data |  |
| 3.8. Using the Grid Editor | ||
|---|---|---|
| | Chapter 3. Manipulating track data | |
The Grid Editor is a tabular editor with an associated xy plot that allows bulk editing of data points, together with data smoothing operations.
Figure 3.28. The Grid Editor
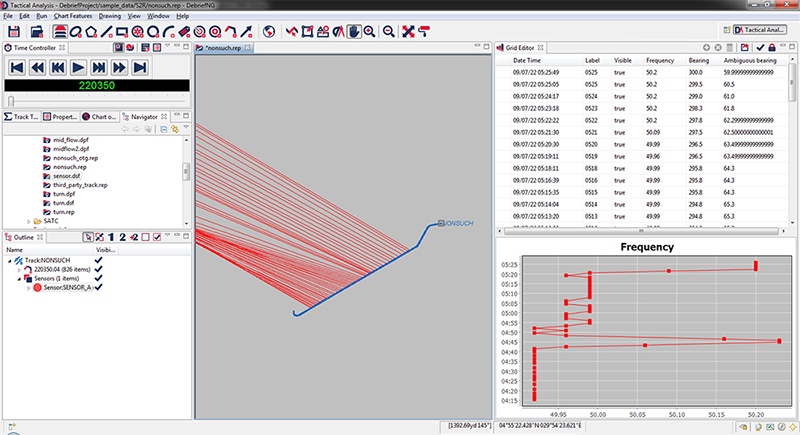
The Grid Editor tracks the current selection in the Outline View. Thus, when you select something capable of being edited in a grid in the Outline View (such as a set of positions or sensor cuts) then it is shown in the Outline View.
![[Note]](images/note.gif) | Note |
|---|---|
|
If this becomes inconvenient you can stop the Grid Editor from tracking the Outline View selection by clearing the Track Selection lock icon. |
When a set of data is first loaded into the Grid Editor it is shown as a plain table. Click into any cell to edit its data. Buttons in the Grid Editor toolbar allow you to insert or delete a row. But, the Grid Editor becomes significantly more capable when you focus on a single attribute. Do this by clicking on the title label for a field (such as depth, bearing, etc).
When you focus the grid editor on a single field it shows an xy plot of that field. This plot can be used to highlight/remove/fix outliers and for general data smoothing operations. Drag points in the graph in order to smooth them, or for Debrief to take on the smoothing for you, select a series of rows either side of the dodgy items then select the interpolate calculator icon to smooth the unselected rows.
See the Groom Sensor Data tutorial for more guidance on these operations.
| |  | |
| 3.7. Grooming track data |  | Chapter 4. Analysing Data |