| Chapter 4. Analysing Data | ||
|---|---|---|
 | Part II. Using Debrief |  |
| Chapter 4. Analysing Data | ||
|---|---|---|
| | Part II. Using Debrief | |
Table of Contents
Analysis is the core function of Debrief. In this section (at last) you are going to gain some familiarity with how Debrief can be used to analyse maritime exercises.
We'll have a brief explanation of the Tote at this point, using the image below.
Figure 4.1. The Debrief Tote
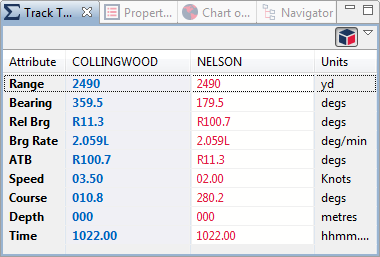
The Tote area is used to show the current and relative status between two or more platform tracks. The information on the Tote is dynamic, showing vessel information at the time indicated in the Stepper Control.
![[Note]](images/note.gif) | Note |
|---|---|
|
The primary and secondary tracks may not contain values exactly at the time in the time stepper control. For both the tote display and the plot-highlights, Debrief uses the data values recorded on or immediately after the indicated stepper time (see the Time for more detail). |
One track currently loaded is assigned as the Primary track (the red track in this instance), and then one or more tracks are assigned as Secondary tracks. The primary track always shows absolute data such as current course, speed and depth. With just a single secondary track specified, it also shows relative (calculated) data - as illustrated above. The secondary tracks always display both absolute data (course, speed, depth), plus the relative data respective to the primary. Thus, remember that if you want to see the primary track's relative bearing to the secondary, make sure there's just the one secondary track selected.
Not only tracks can be placed on the Tote. Most annotations (labels, circles, etc) can also be set as primary or secondary track. If no time is available for an annotation it is deemed to always be valid, and calculations are shown although the time field is displayed as "n/a". However, if the annotation has start and end times the tote displays "n/a" when outside that period and calculated data when inside it.
| Note |
|---|---|
|
It may be useful to remember that the Primary Track is usually assigned to the Target, thereby allowing a constant display of target bearing and range. |
There can be any number of secondary tracks. Debrief displays calculated results of the relationship between each one and the Primary Track. To see the relationship between a pair of secondary tracks, one of them must be set to the Primary track.
The following calculated data is presented, where the current point on each track is used for the calculation:
The range between the current point on the secondary track and the current point on the primary track using the earth model as described in the Glossary, displayed in the units stored in the Debrief preferences window. Debrief NG introduced the option of showing slant range, accessible from Debrief's Preferences window. If you have indicated that you want to view slant range, then the range shown is a function of horizontal range and vertical separation.
The bearing between the points.
The relative bearing and Angle on The Bow from the perspective of that column's track.. There are two formats used for relative bearing, depending on the setting of Relative bearing format in the / dialog. If the format is specified as UK, the R and G characters at the start of the result are short for Red and Green, which indicate that the contact is to the Port or Starboard of the secondary track. If the format is specified as US, the value uses 0 as directly ahead and continues clockwise through 180 (astern) and back round to 359.9.
The current speed of the indicated track (no actual calculation is performed here; the value from the data-file is displayed directly).
The current course of the indicated track (no actual calculation is performed here; the value from the data-file is displayed directly).
The current depth of the indicated track (no actual calculation is performed here; the value from the data-file is displayed directly).
The instantaneous bearing rate of the secondary track as observed from the secondary track. This value is explained in the Glossary.
Where track data is not recorded at regular steps, and tracks do not have data at the same time steps, there is a likelihood that the value displayed on the tote will not have been recorded at the current tote time. The time field shows the actual time at which the data value was recorded for that track.
| Note |
|---|---|
|
When more than two tracks are loaded, the value n/a is shown in Tote calculations for the primary track which rely on other track data (range, bearing, rel bearing, brg rate). This is because it is unclear which inter-track relationship is being calculated. Where only two tracks are loaded (one primary and one secondary), the tote is able to show relative calculated data for both. |
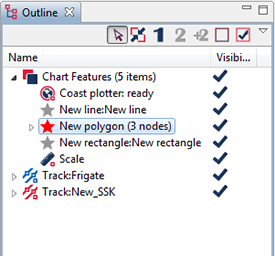
Assigning primary and secondary tracks is covered in the respective Cheat Sheet. Icons are provided in the Outline View toolbar to specify if the selected track should be:
Made primary
Made secondary
Added to the list of secondaries
Figure 4.2. Assigning Tracks
![[Tip]](images/tip.gif) | Tip |
|---|---|
|
If you have more than two tracks, it can be quicker to assign the primary track manually and then press to assign the remaining tracks as secondary. |
![[Warning]](images/warning.gif) | Warning |
|---|---|
|
A Circle currently only has a single "Centre" DTG value - so it will only be highlighted for 3 minutes either side of this point. Better results are obtained by using a Label (which has a picture of a text label on it), since Labels have start and finish DTGs. |
| Note |
|---|---|
|
It is not just tracks that can be added to the Tote, experiment with right-clicking on features on the plot and see if they have the "Set Primary Track" or "Set Secondary Track" commands available (although read the note below about these). In this way you can make a timed data point (represented by a Circle with a very small radius) the primary track, then add a number of vessel tracks as secondary tracks, and then as you move through the data you can constantly see the vessel range and bearings from this data point. This is particularly useful for seeing vessel ranges and bearings from a sensor such as a sonar buoy. Remember to set the DTG data for the data point to time(s) near those of the track - or else in your example Debrief will assume the "sonar buoy" is not yet active. |
| Note |
|---|---|
|
The limits on the time period are the outer time limits of the visible data in the primary and secondary tracks currently displayed on the Tote, so following a filter operation (introduced later) the start/end times will be changed to reflect the time limits specified. |
| Note |
|---|---|
|
The keyboard can also be used for moving backwards and forwards, although Debrief has to know that it's the Stepper that you want the keys to control. So, after clicking on the time-slider control you can then switch to keyboard control of the Tote as follows:
|
| Tip |
|---|---|
|
Debrief has an interpolates points property which, when ticked, interpolates the positions between actual data points. The highlight cursor changes appearance when on an interpolated data point. Figure 4.3. Display of an interpolated point  |
| |  | |
| 3.8. Using the Grid Editor |  | 4.2. Controlling time |