| 4.4. Show time-related variables | ||
|---|---|---|
 | Chapter 4. Analysing Data |  |
| 4.4. Show time-related variables | ||
|---|---|---|
| | Chapter 4. Analysing Data | |
Time-variable plots can be opened via the Outline View. When one or more items that are candidate subjects [2] for a time-variable plot are selected in the Outline View, it adds the operation to its right-click menu. After requesting the plot, the user is invited to indicate which calculation is to be plotted, and which track is to be used as the primary track (where relevant).The example below shows the results of a Range calculation between two tracks. Note that dragging the mouse downwards in a rectangle inside the plot zooms in on the data, dragging the mouse upwards into a rectangle zooms out on the data, and that the button zooms out to show all of the current data. Where data is not present, a gap is inserted into the data-line.
Figure 4.10. View of time-variable plot
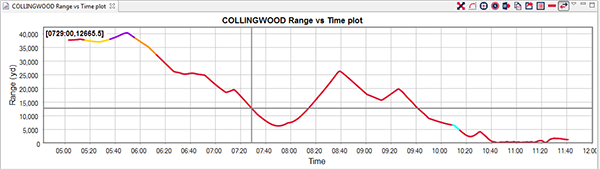
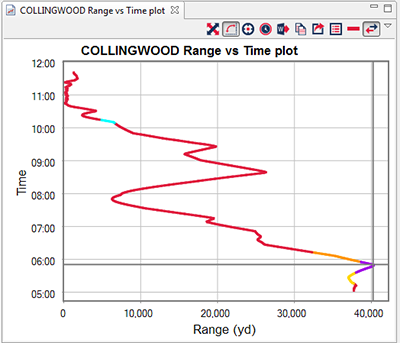
Figure 4.11. View of time-variable plot in waterfall mode
![[Note]](images/note.gif) | Note | ||||||||||||||
|---|---|---|---|---|---|---|---|---|---|---|---|---|---|---|---|
|
Debrief performs special processing depending on whether the selected items contain valid time data or not. In general, when an annotation (such as a label) does not contain DTG data Debrief assumes that it is valid throughout the selected time period. Debrief produces the time-variable plot according to the following tables: Table 4.1. Relative calculations (range, bearing, etc)
Table 4.2. Absolute calculations (range, bearing, etc)
|
The
 button writes the current graph to a Windows Metafile in the current WMF_Directory, and the (
 places a copy of the plot on the Windows clipboard for onward insertion into MS Word
The
 button changes the orientation of the plot from its default format to a waterfall-style display with time plotted down the left-hand side.
The
 button changes the time axis to make the top of the waterfall display the current Time Controller time, with the data displayed changing dynamically with time slider..
The (
 ) button opens a property window (see Properties window) allowing you to control the presentation of the time-variable graph using the following properties:
| Parameter | Description |
|---|---|
| DataLineWidth | The width to plot the data-lines on the graph |
| DateTickUnits | The interval (and format) to use on the date axis |
| RelativeTimes | Whether to plot absolute or relative times (used when analysing time-zero data). See Section 4.4, “Show time-related variables” . |
| ShowSymbols | Whether to show datum symbols (useful to indicate different data recording rates) |
| Title | The Title of the graph |
| X_AxisTitle | The x-axis label on the graph |
| Y_AxisTitle | The y-axis label on the graph |
| xxx Font | The font to use for the respective label |
| DisplayFixedDuration | When data is being displayed in Grow Timesmode, this checkbox specifies whether time-axis should grow to continuously show all data, or whether it should just show data for a fixed time period. |
| FixedDuration | The period of time (duration) that the time-axis should display when in Grow Times mode with DisplayFixedDuration set to True. |
If there are tracks on the Debrief Tote, a vertical bar is drawn through the plot at the correct time. If the current time on the Tote occurs before the earliest time on the Time-Variable plot then the bar is drawn at the minimum value, and drawn over the maximum value if the current time on the Tote occurs after the latest time value. The bar redraws itself automatically as the time in the Tote changes.
By default the time-variable plot shows absolute times (e.g. 12:34.00). Some forms of analysis conducted with Debrief rely on the use of relative times. To show these relative times on the lower axis of the time-variable plot, select RelativeTimes from the time-variable plot property window. Once this mode is selected, times will be shown relative to the last time-zero value set. By default, the times are shown in a normal HH:mm:ss format, but the DateTickUnits drop-down list contains a number of display formats which specifically support presentation of elapsed times.
[2] Items are suitable for inclusion in a time-variable plot when they have both temporal and spatial attributes, so this includes tracks, individual locations and annotations, but does not include grids, scales, or background datasets.
| |  | |
| 4.3. Measuring range and bearing |  | Chapter 5. Exporting Data |