| Chapter 3. Manipulating track data | ||
|---|---|---|
 | Part II. Using Debrief |  |
| Chapter 3. Manipulating track data | ||
|---|---|---|
| | Part II. Using Debrief | |
Table of Contents
Before you are able to analyse or export plots from your data you need to know how to format what you see to improve its legibility. Learn more about formatting tracks in the Editing your data tutorial.
![[Note]](images/note.gif) | Note |
|---|---|
|
Apologies in advance to the British users of Debrief for the American-spelling of colour. The software environment within which Debrief is developed is American, and in this case superimposing the UK spelling upon it is not a battle worth fighting. |
Figure 3.1. Properties view
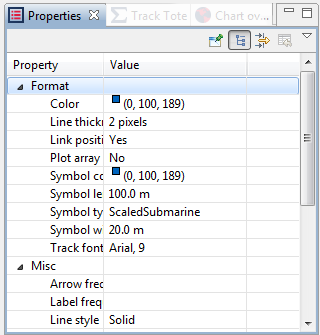
Track editing is performed on the Properties Window (see Properties window), and is initiated by selecting the track either from the plot or the Outline View, as described in the Editing your data tutorial.
| Note |
|---|---|
|
Many of these editing operations can be performed without using the Properties Window, simply by right-clicking on a track either in the Outline View or on the plot |
In addition to switching the symbols, labels and arrows on and off for individual positions, you can instruct Debrief to show symbols or labels at one of a series of frequencies - allowing you to quickly add 15 minute symbols and hourly time labels to a track. The timings of the particular positions that get highlighted do not have their origin at the start of the track - but from 0000 hrs - thus the 15 minute positions will be marked for 00, 15, 30, 45 minutes past the hour.
| Note |
|---|---|
|
Where a position on a track is marked as having its arrow and symbol visible, the arrow takes precedence - so only one will be displayed. In this way can request 5 mins symbols, and 30 min arrows: this will give you 5 min symbols, except on the 1/2 hour, when an arrow will be shown. |
The track-shifting function has been incorporated to allow users to move a track and its associated sensor data. The principle requirement for this functionality is to enable the user to move the track to a specific geographic reference point (i.e. GPS fix) or to lock the relative position of one track to another using sensor data. This positioning relative to another track is sometimes termed plot-lock or tie-point .
| Note |
|---|---|
|
The Track-shifting implementation was originally provided by Mr David Gong at NUWC. |
Debrief NG provides three modes of track shifting - moving individual track segments, moving individual points in a track to correct a potentially erroneous data point, moving whole tracks to overcome navigational system inaccuracies - such as during a plot-lock or tie-in. See the three modes above in Section 2.2, “Mouse mode buttons”.
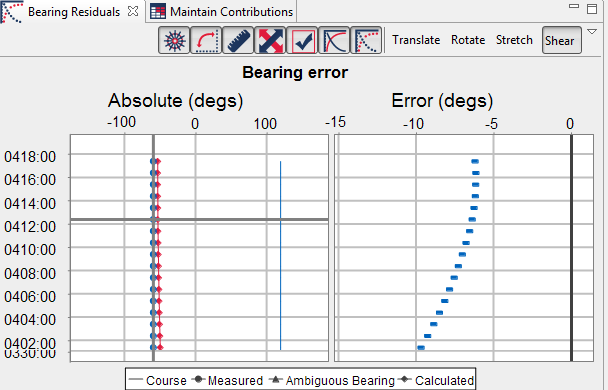
A Stacked Dots view is used to show bearing-errors when the track-shift is being conducted to line up one or two sets of sensor data (see Chapter 11, Analysing sensor data). For each sensor bearing on a track (see Sensor contact), Debrief identifies the point on the opposing track nearest to that time. Each time the track is shifted (dragged) Debrief calculates the error between the sensor bearing and the current measured bearing, showing these in a plot (bearing error against time).
| Note |
|---|---|
|
A Sensor Offset measurement (see Section 11.1.4, “Sensor offset lengths editor”) is applied to the sensor bearing line where there sensor datum is offset from the attack datum of the platform |
Debrief displays a symbol for each visible sensor data, with the symbol being plotted the same colour as the sensor data. When track-shifting a long exercise serial, the time-variable plot may become difficult to use due to the y-axis always auto-scaling to accommodate all available data. Overcome this by instructing Debrief to filter-to-time-period (see Section 4.2.8, “Manipulating according to time period”) from the time controller (Section 4.2.1, “The Time Controller”) for the plot-lock period, thus viewing a much smaller data-set in the time-variable plot. Additionally, you can zoom in on a particular area (by dragging an area downward and to the right) of the time-variable plot for detailed analysis, dragging the mouse up and to the left to clear the zoom.
Note the four modes of drag supported by the bearing error view. For the non-translate operations you are still able to perform a translate by picking up the track segment at its mid-way mark.
Figure 3.2. Stacked Dots view
For the track-shifting to work, your data must be configured as follows:
You must have a Debrief plot open (duh)
You must have a vessel track as the primary track on the Tote (see Section 4.1.1, “Tote area”) - not an annotation or other time-related object
You must have a secondary track on the Tote, but only one secondary track. This must also be a vehicle track.
The primary track must have sensor data (see Chapter 11, Analysing sensor data).
| |  | |
| 2.6. Formatting the plot |  | 3.2. Adding chart features |