| 3.4. Layer management | ||
|---|---|---|
 | Chapter 3. Manipulating track data |  |
| 3.4. Layer management | ||
|---|---|---|
| | Chapter 3. Manipulating track data | |
The Outline View provides a tree-oriented view of all of the editable data within a plot, organised into layers. New items added to the plot are placed into a Misc layer. From here they can be reorganised into suitably themed layers via cut/paste (see Section 3.4.2, “Cut/Copy and Paste”).
Figure 3.19. Outline View
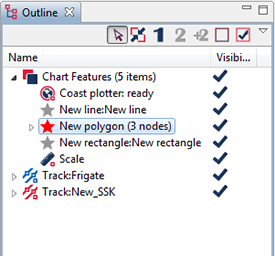
Reveal the Outline View by selecting it from the / drop-down list. Once open you will see the data shown as a series of layers - each with a tick indicating if it's visible or not. A toolbar provides command buttons to make items visible or not visible, and buttons are enabled to make an entity the primary or secondary track, or to add the selected item as another secondary (when applicable). Note that not just tracks may be denoted primary or secondary: and graphic item with a position and date-time can be selected: thus Debrief can be configured to show a running indication of bearing and range for a series of vessels from a single label datum (representing a sonar-buoy or mine).
The drop-down menu provides further commands, significantly including the ability to add a new layer; . Further commands are available when right-clicking on one or more Outline View elements: in particular the ability to cut/copy/paste elements between layers and plots, together with the command to view a time-variable graph of the selected elements (see Section 4.4, “Show time-related variables”).
Items may be cut, copied and pasted between Layers using the commands contained in the menus obtained by right-clicking on the item. The cut command may be used on its own to delete an item. Copying items is a quick way of making duplicates of a correctly formatted annotation or screen item such as a rectangle or ellipse.
In addition to copying/moving items between layers, items and layers themselves can be copied or moved between sessions within Debrief.
To paste a layer (or track) into the top level of the Outline View just click on the white space below the displayed layers and select form the popup menu.
![[Note]](images/note.gif) | Note |
|---|---|
|
All top-level layers (that it screen items which appear at the top level in Layer Manager, such as Tracks, ETOPO data and Layers themselves) can have a line width assigned to them. This setting is observed when plotting all items in that layer. The smallest line width supported is hairwidth, which plots the finest line the particular output device (screen or printer) can produce. The line-width parameter can be accessed by right-clicking on the screen item directly in addition to via the Outline View. |
![[Warning]](images/warning.gif) | Warning |
|---|---|
|
In addition to the menu command, is the command. This doesn't store the removed items on the clipboard, and is suited for bulk data point removal. To further ease the memory burden of this large operation it isn't possible to the command. |
| |  | |
| 3.3. Adding drawing features |  | 3.5. Saving and re-opening plots |