| 3.3. Adding drawing features | ||
|---|---|---|
 | Chapter 3. Manipulating track data |  |
The Drawing toolbar and menu are used to place geographic features on the plot; features which are geographically fixed. In general, when you create them, their corners must be specified by copying a location from the plot and posting it into the property of the relevant corner.
Figure 3.13. Drawing toolbar

![[Note]](images/note.gif) | Note |
|---|---|
|
By default, new drawing features are placed in the |
The Label drawing item allows you to place a labelled symbol on the plot. Typically this may be used to annotate events on the plot, or to add an extra feature which did not warrant its own Debrief REP entry. Like all annotations Labels have time start and end properties. Because of this they can be placed on the Tote (see Section 4.1.1, “Tote area”) and used in analysis, as you will learn later.
![[Tip]](images/tip.gif) | Tip |
|---|---|
|
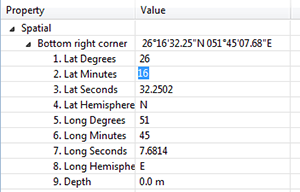
A custom editor is supplied (see below) for editing locations of data items, it is used frequently in Debrief. Clicking on the expand button will let you edit individual lat/long fields (shown in figure Figure 3.15, “Location Editor (expanded view)”). Alternatively, you may set the location to a specific point on the plot. Right-click on the plot and select . Then click once on the location editor to reveal the button (shown in Figure 3.16, “Location Editor (paste view)”), and click it to paste the cursor location. Figure 3.14. Location Editor (initial view)  Figure 3.15. Location Editor (expanded view)  Figure 3.16. Location Editor (paste view)  |
![[Note]](images/note.gif) | Note |
|---|---|
|
Note that the text for the label itself can be a multi-line piece of text. When in the text-editor box for the label, just press the return key on your keyboard to move to the next line. The multi-line piece of text will be centre formatted on screen according to the Label Location property. The multi-line label is also available for all labels on the Debrief plot. Note that when the label is stored to disk in the Debrief plot-file format, the '\n' character used internally to represent the new line is converted to a '\\n' string to allow its easy storage. |
The Ellipse shape works in much the same way as a Label, except an ellipse is drawn on the plot instead of the labelled symbol. The size of the ellipse is dictated by the Maxima and Minima values which specify the lengths of its semi-major and semi-minor axes, expressed in user-selectable distance units. These values are the distances from the centre of the ellipse to the furthest and closest points on its perimeter, respectively. The direction of the ellipse is specified by the orientation, expressed in degrees. Debrief does not check that the maxima is larger that the minima, it merely plots an ellipse oriented about the semi-major axis.
The Polygon drawing feature allows more varied shapes to be plotted within Debrief. A series of points (called a Path) are added to a Shape which are the connected up to create a Polygon. The points in the path may be typed in, double-clicked, or dragged to produce the correct polygon.
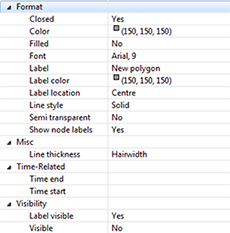
When a new polygon is created, its editor panel will open as shown below:
Figure 3.17. Initial view of polygon

The properties shown are similar to those shown for most other shapes, with the exception of the actual locations of the polygon. Change the location of the nodes that form the polygon by selecting them in the Outline View then editing them the Properties View (see Figure 3.1, “Properties view”). New nodes are created by right-clicking on the Polygon (in the Outline View or on the Plot), and selecting .
The Rectangle, Circle and Line shapes work in the same way as the others described here, the Location Editor described above being used to set the corners, centre, or ends as required.
![[Note]](images/note.gif) | Note |
|---|---|
|
Some of the more basic drawing items have a single DTG parameter instead of TimeStart and Time_End properties. Where there is a single time, the time-analytical features of Debrief (such as Snail mode) treat the feature as alive for three minutes either side of the time value. |
![[Tip]](images/tip.gif) | Tip |
|---|---|
|
To draw a line created from an origin with values of range and bearing, first create the line, and put the start point of the line at the origin. Now switch the mouse mode to Range/Bearing (
|
To edit any existing annotation, double on it on the plot or the Outline View to select it - its attributes will then be available from the Properties View. Alternatively, right-click on an item on the Plot or Outline View, and editable attributes are available from the object's drop-down list. Only boolean (true/false) and list-related (top/bottom/left/right etc) are editable from the right-click menu.