| 13.3. Monitoring a DIS simulation | ||
|---|---|---|
 | Chapter 13. Support for DIS Protocol |  |
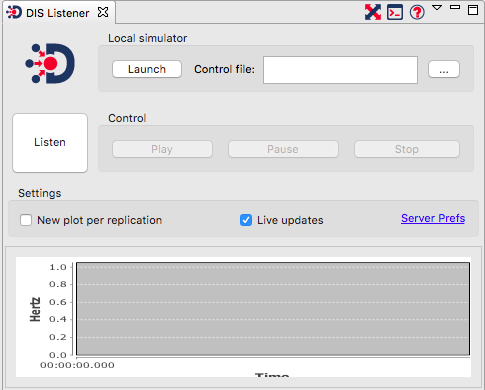
Interaction with DIS scenarios is performed from the .

At the top of the panel are two small icons. The first has a toggle behaviour, and when ticked Debrief will auto-resize at each step, to ensure all loaded data remains visible. The second icon opens the Console view (to keep track of messages returned by the launched simulator - see more at Section 13.4.3, “Track the simulator using the Console”), and the final one accesses the help for Debrief's DIS integration.
If you have specified the path to an executable in the (see Section 13.2.2, “Configuring the launch of an external simulator”), then you can use the box to (optionally) specify the location of the input file to be passed to the executable. Click on the button to open a file browser.
Once a control file has been specified, you can click on the button to start the simulator executable, passing the input file to it. After launching Debrief will automatically start listening on the correct network port.
![[Tip]](images/tip.gif) | Tip |
|---|---|
|
A quick way of setting the input file is to drag one from the view oneo the path. This will update the input file path to the one dragged in. An even quicker way of running a different input file is to right-click on a |
The large listen button is used to toggle whether Debrief is listening for DIS messages.
If Debrief receives sufficient network status messages from the simulator, Debrief will enable the , , . After has been pressed, and new DIS messages received will be put into a new plot (existing data will be wiped).
Two other minor options are provided. If is ticked, when Debrief recognises that data for an new simulation run is being received, Debrief will open a fresh plot to contain the data.
![[Note]](images/note.gif) | Note |
|---|---|
|
If the current plot is based on a |
If the simulator is running very quickly, and it looks like the UI is getting swamped with updates, the checkbox can be cleared, which will let Debrief continue to receive and store DIS messages, but Debrief will not bother updating the user interface (the Outline view or the Plot Editor).
Lastly, the link can be used to open the preferences page for Debrief DIS communications.
On the DIS Listener view's drop-down menu is a Log Messages toggle button. When this is selected, Debrief will log all messages to the Debrief system log. This log can be accessed via the Window / Show View / Error Log menu option. The .log file is chunked into 1Mb files, and is stored in the hidden .DebriefNG/.metadata folder within your home directory. To remind the user about this logging (with its associated performance and disk usage penalty), the Scenario Complete popup dialog includes a reminder that logging is active, when relevant.
At the foot of the is a performance graph. When a simulation is being listened to, this graph updates once per second. It shows two lines. One is the frequency at which simulation messages are being received, and the second is the frequency of screen updates. As more data is received, and shown on the plot, the frequency of screen updates will slow down.
Inspection of this graph can give the analyst an indication of whether the simulator is running, how quickly it is running, and how Debrief is handling the volume of loaded data.