WHAT'S NEXT
We're rebuilding Debrief from the ground up for the next generation of analysts
Browser & Desktop
Run in VS Code, Electron, Jupyter notebooks, or any modern browser. No Java installation required.
Python-First
Domain scientists can build their own analysis tools in Python without needing Java or Eclipse expertise.
Open Standards
GeoJSON, STAC catalogs, and schema-first design. Your data stays portable with no vendor lock-in.
BENEFITS

Open Source
Debrief’s Open Source license means that it is (and always will be) completely free to use, plus you’ll never suffer “Vendor lock-in”.

Multi Platform
Debrief’s Java foundations mean that it will run on 32 and 64 bit versions of MS Windows, Apple OSX and Linux.

Mature
Under continuous maintenance since 1995, the algorithms underpinning Debrief have had around two decades of testing and development.

Capable
A suite of custom data views mean that challenging analysis tasks become easy and straightforward, allowing the analyst to focus on considered observations rather than collating data.

Reliable
Currently in use by Navies, Governmental and non-Governmental organisations around the world, the Debrief software has unprecedented levels of reliability.

Supported
This well documented, standards adherent application is easy to maintain, either within your own organisation or with commercial contracted support.
CAPABILITIES
Analysis & Reporting
Debrief supports the full maritime analysis process, from loading data, through analysing that data, to producing attractive and persuasive images in your analysis report.
See the full screencast
Trials Planning
Debrief has specialised capabilities that make it ideal for the whole equipment trials process: covering planning, analysis and presenting results.
See the full screencast
Single Sided Reconstruction
Debrief can be used to produce a solution for target tracks based on bearing data, even for multi-leg engagements that are typically challenging using manual TMA capabilities.
See the full screencast
OUR USERS
Debrief has years of experience providing top notch analysis capabilities to tier one organisations throughout the World


FEATURES
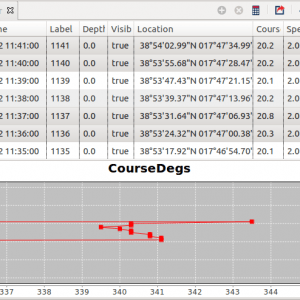
Yes, the onboard sensors may be less than perfect. Don’t worry, Debrief’s Grid Editor allows you to use your understanding of the data to perform a range of grooming operations: from removing outliers, inserting missing data, right through to smoothing values to remove quantisation artifacts
Learn more
It’s not just track plots that can be exported from Debrief. All those Time-Variable plots can also be exported, to be inserted directly into your Analysis Report or Quick-Look Briefing document.
Learn more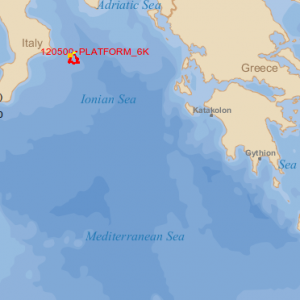
Everybody likes detailed charts. The Debrief Natural Earth background dataset delivers natural looking maps, with bathymetric shading. Developed by a professional cartographer, our custom set of Natural Earth themes & styles is dedicated to the maritime domain. Our maps will certainly put a shine on your next briefing.
Learn more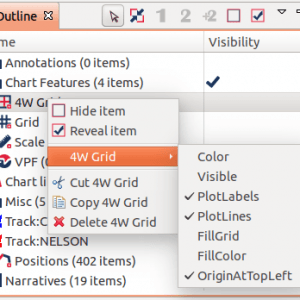
You may have a lot of different types of data loaded, but the Outline view - a layered tree of all of the currently loaded data - makes it easy to edit, analyse and format. Right-clicking opens contextual editing, giving you quick access to editable properties and transformations - even with multiple items selected.
Learn more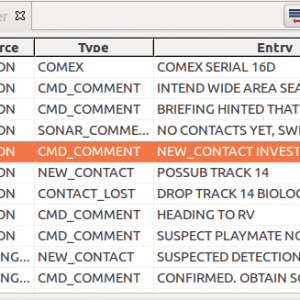
It’s easy to use the Narrative Viewer to combine time-stamped textual data with the dynamic track plot. Human or system-generated text entries can be attributed to any one of the platforms, or to a particular message type, and then quickly filtered to focus on a particular entry type.
Learn more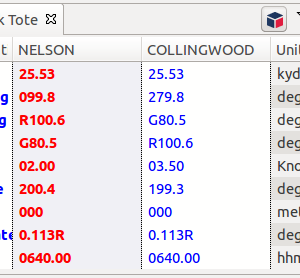
Don’t worry about pulling out your protractor and slide rule to calculate the relative geometry between subject platforms. Once a participant is denoted as primary, you can add any number of other platforms as secondaries. Immediately, Debrief displays their range, bearing, and platform states, synced to the currently displayed time.
Learn more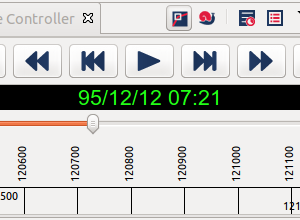
The Time Controller is the home of all time-related activity. You’ll use the main slider to control the point in time at which data is displayed. But this composite control goes a lot further to help you select and refine your snapshot. Use it to show or hide data, to show whole tracks or just recent points, to orient the plot, and to highlight the current location by marker, platform symbol or sensor coverage rings.
Learn more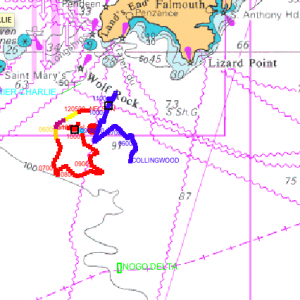
You always need to see accurate tracks. But on occasion, it’s the background context that is fundamental to understanding the on-board decision making process. Or, you just need to give some chart context to help your reader understand exactly where the trial took place. Support for Admiralty Charts means it’s possible to view a whole chart catalog, then load only the charts of interest.
Learn more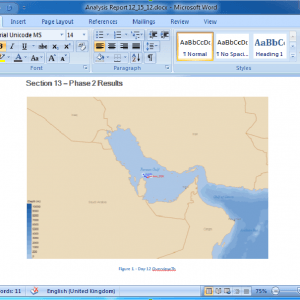
We all know that conducting effective data-driven analysis is only half of the challenge. Your analysis has to be persuasive, and make an impact. With Debrief it’s quick and easy to copy a plot to the clipboard, then paste it directly into your favourite office suite.
Learn more
Everybody likes detailed charts. The Debrief Natural Earth background dataset delivers natural looking maps, with bathymetric shading. Developed by a professional cartographer, our custom set of Natural Earth themes & styles is dedicated to the maritime domain. Our maps will certainly put a shine on your next briefing.
Learn more
You may have a lot of different types of data loaded, but the Outline view - a layered tree of all of the currently loaded data - makes it easy to edit, analyse and format. Right-clicking opens contextual editing, giving you quick access to editable properties and transformations - even with multiple items selected.
Learn more
It’s easy to use the Narrative Viewer to combine time-stamped textual data with the dynamic track plot. Human or system-generated text entries can be attributed to any one of the platforms, or to a particular message type, and then quickly filtered to focus on a particular entry type.
Learn more
Don’t worry about pulling out your protractor and slide rule to calculate the relative geometry between subject platforms. Once a participant is denoted as primary, you can add any number of other platforms as secondaries. Immediately, Debrief displays their range, bearing, and platform states, synced to the currently displayed time.
Learn more
The Time Controller is the home of all time-related activity. You’ll use the main slider to control the point in time at which data is displayed. But this composite control goes a lot further to help you select and refine your snapshot. Use it to show or hide data, to show whole tracks or just recent points, to orient the plot, and to highlight the current location by marker, platform symbol or sensor coverage rings.
Learn more
You always need to see accurate tracks. But on occasion, it’s the background context that is fundamental to understanding the on-board decision making process. Or, you just need to give some chart context to help your reader understand exactly where the trial took place. Support for Admiralty Charts means it’s possible to view a whole chart catalog, then load only the charts of interest.
Learn more
It’s not just track plots that can be exported from Debrief. All those Time-Variable plots can also be exported, to be inserted directly into your Analysis Report or Quick-Look Briefing document.
Learn more
Everybody likes detailed charts. The Debrief Natural Earth background dataset delivers natural looking maps, with bathymetric shading. Developed by a professional cartographer, our custom set of Natural Earth themes & styles is dedicated to the maritime domain. Our maps will certainly put a shine on your next briefing.
Learn more
The Time Controller is the home of all time-related activity. You’ll use the main slider to control the point in time at which data is displayed. But this composite control goes a lot further to help you select and refine your snapshot. Use it to show or hide data, to show whole tracks or just recent points, to orient the plot, and to highlight the current location by marker, platform symbol or sensor coverage rings.
Learn more
You always need to see accurate tracks. But on occasion, it’s the background context that is fundamental to understanding the on-board decision making process. Or, you just need to give some chart context to help your reader understand exactly where the trial took place. Support for Admiralty Charts means it’s possible to view a whole chart catalog, then load only the charts of interest.
Learn more
We all know that conducting effective data-driven analysis is only half of the challenge. Your analysis has to be persuasive, and make an impact. With Debrief it’s quick and easy to copy a plot to the clipboard, then paste it directly into your favourite office suite.
Learn more
Yes, the onboard sensors may be less than perfect. Don’t worry, Debrief’s Grid Editor allows you to use your understanding of the data to perform a range of grooming operations: from removing outliers, inserting missing data, right through to smoothing values to remove quantisation artifacts
Learn more
You may have a lot of different types of data loaded, but the Outline view - a layered tree of all of the currently loaded data - makes it easy to edit, analyse and format. Right-clicking opens contextual editing, giving you quick access to editable properties and transformations - even with multiple items selected.
Learn more
It’s easy to use the Narrative Viewer to combine time-stamped textual data with the dynamic track plot. Human or system-generated text entries can be attributed to any one of the platforms, or to a particular message type, and then quickly filtered to focus on a particular entry type.
Learn moreReady to try?
Like Debrief? Why not give it a whirl, it is (and will always be) free! Or use the form below to let us know if you need anything more.
GET IN TOUCH WITH US
If you’d like to learn more about Debrief, or would like to discuss support options please send a message to
contact@debrief.info
Send a message now!