Continuing from the previous article regarding support for non-time datasets, we're now going to consider how to collate two non-time indexed dataset to produce a 2D dataset that can be displayed as a heat map. Background The big picture objective is to view a two-dimensional plot containing the signal strength from a transmitter (tx) mapped...
Read MoreA shortcoming of the initial backend datastore for Limpet (learn more here: http://limpet.info) was that it could only store datasets that were indexed by time. This had little impact, since Limpet was only being used for analysis of time-stamped data. But, for the second phase of support for multi-static analysis, Limpet must store data indexed...
Read MoreLast year's addition of Stacked Charts in Debrief started the movement towards more free-flowing analysis using Debrief. Stacked Charts allowed the analyst to consider the relationships between any kind of data in Debrief. Traditionally Debrief had a tightly focused data model: platform tracks plus some sensor data. While new graphical annotations and cosmetic styling of...
Read More
We’re launching a new capability for a broader set of analysis. In addition to running standalone this tool will be seamlessly integrated into with Debrief. Why Do We Need a New Tool? Debrief traditionally enjoys a fixed data model, understanding precisely how to exploit, visualise and process each type of data. Over the years analysts...
Read More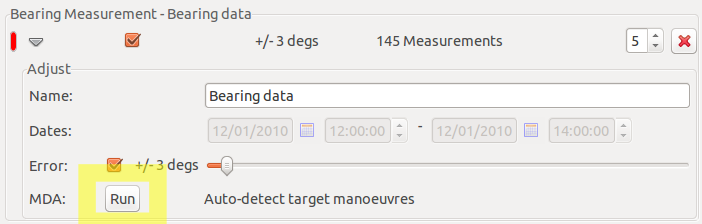
Abstract Since last Autumn we’ve been working on a significant part of SATC (Semi Automatic Track Construction – see more here). The genetic algorithms in SATC are now quite mature, and do a good job of producing target tracks from bearing only data. But the analysts have had an ongoing chore – the need to...
Read More
Abstract A group of analysts were having trouble understanding the track followed by vessels in exercises from data collated from a number of sensors, They had a third party file converter for extracting data from Sonar S2087. When S2087’s file formats changed in 2014, the 3rd party converter became obsolete, and the analysts were stuck...
Read More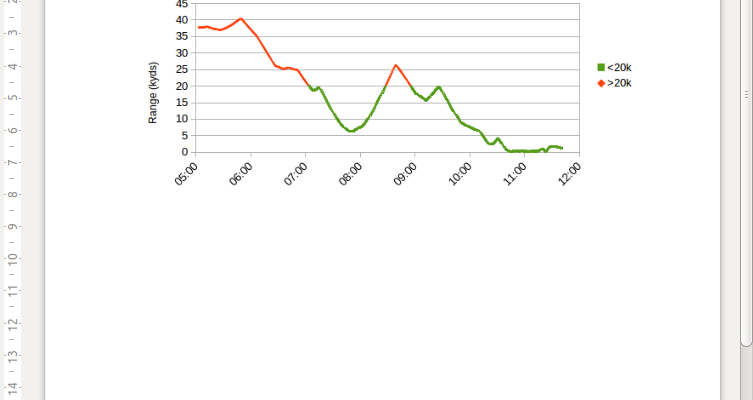
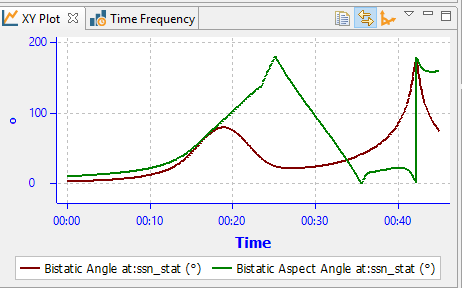
Abstract This posting discusses a modification that was made to make Debrief’s calculated data more accessible to scientific users. Whilst Debrief has lots of tools for data analysis, it remains possible to export this data to a spreadsheet for external analysis. Customer MWC Backstory An analyst needed to product a custom XY chart to prove...
Read More